
User Behavior Analysis with Machine Learning
Introduction
In 2023, the DBIR Report discovered that 86% of web breaches occurred due to stolen login information. As preventing attacks remains a vital aspect of overall security measures, DataSunrise offers enhanced mechanisms for database user suspicious behavior monitoring.
Databases often manifest compromised user credentials or infected systems through attempts to elevate privileges or access different databases or schemas, such as ‘pg_catalog’. A common situation occurs when a user attempts to access the database from an unfamiliar IP address. This often indicates suspicious activity, possibly due to compromised user credentials.
DataSunrise User Suspicious Behavior task uses machine learning (ML) tools to monitor user behavior and address suspicious cases effectively. Its machine learning approach facilitates a flexible setup of the tool without the need to manually configure whitelisted IP sets or allowed databases and schemas for specific users. This eliminates the necessity of precisely setting up IP addresses or databases by hand.
Audit Database Activity
Before discussing the behavior monitoring, we should make note on how we gather the ML training data. DataSunrise has a tool called Audit that logs activity. You can find the logs in Audit → Transactional Trails.
The DataSunrise Audit logs data to track how database users typically behave and can also help monitor any suspicious activities.
The data collected is text-based and often too large to analyze without specific tools for data analysis. DataSunrise has everything you need to process large amounts of data and draw conclusions from the insights it provides.
To create a User Suspicious Behavior task, you need the right training data from the Transactional Trails. You also need to run the behavior analysis task within the correct time range.
During the first run, the task trains the statistical model. Later runs involve analyzing the Transactional Trails from the training range’s end to the Transactional Trails’ end.
ML tools for User Behavior Monitoring: Case study
The scenario is as follows: The company utilizes a web-based application with a database for managing client data. The company will regularly check for any unusual activity in the database tables, either by hand or every hour.
There are three main steps to implement the User Behavior analysis Task:
Step 1: Create an Audit Rule to monitor queries via the Proxy Port to the resource database. Find an appropriate training timespan based on the active Rules Transactional Trails. This is a preliminary step needed to provide the training dataset.
In a typical DataSunrise setup, there are multiple Audit Rules and extensive Transactional Trails logs. So, the user can check that the Transactional Trails for the chosen time period only show approved user activity.
Step 2: Create a User Behavior Task with an appropriate training timespan. Set up the Task to run for the first time to train the statistical model.
Step 3: Execute some unusual activities using third-party tools like ‘psql’ or ‘DBeaver’. Then manually run the task again for analysis. This helps ensure the rule works properly.
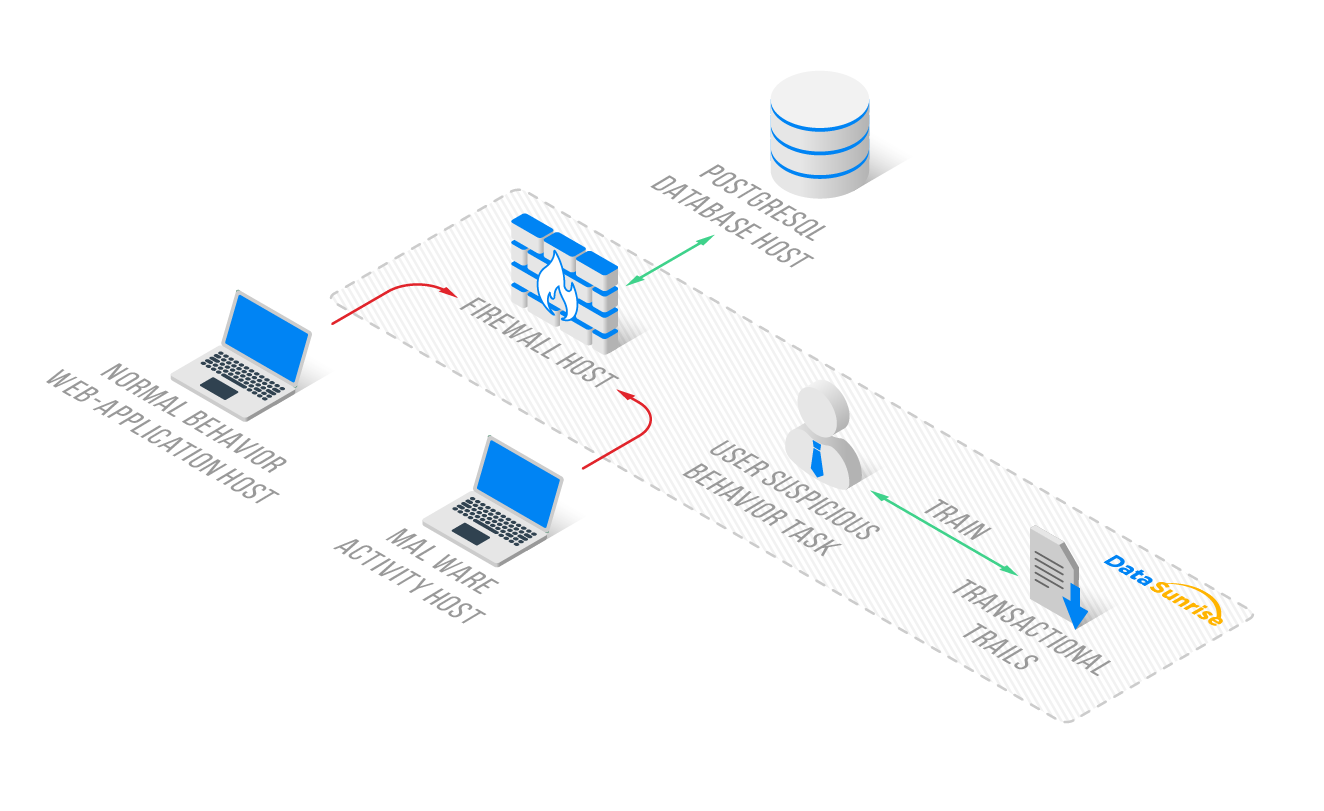
The Normal Behavior Host (on the left side of the image) contains a web application. This host typically serves as the server instance connected to the database through the Firewall Host (in the center). We installed DataSunrise on the Firewall Host, and its Transactional Trails record the database connections through the DataSunrise Proxy Port 5432.
Step 1: Audit Rule for Regular Actions
To make an audit rule, first, go to the DataSunrise Web-based UI. Next, click on Audit, then Rules. Finally, click on +Add Rule if it is not already there.
You should enable AuditObject in System Settings – Additional Parameters. The Audit Rule should track only approved user actions for training. Users can always check it in Transaction Trails later.
Enable the rule you’ve just created. The requests to the database should appear in the events of the rule. During this step, we analyze the Transactional Trails and select the timespan of normal activity events to use for User Suspicious Behavior training.
Step 2: User Suspicious Behavior Task
Now that we have ensured the training data is present and selected the training timespan, it’s time to create a User Suspicious Behavior Detection task. To do this, navigate to Configuration – Periodic Tasks – +New Task.
From the Task Type list, select Suspicious User Behavior Detection. The only setting required here is to define the range of training dataset events. Furthermore, there is a Startup Frequency option for the task, but in our case, where we manually run the task as needed, we can leave the frequency at the default (Hourly).
Below is the setup for the timespan of the new User Suspicious Behavior Task.

We define the timespan during which only allowed activities occur on all Proxies of the Database Instance. These activities are the whitelisted ones, and we selected the first and last event times during the analysis in Step 1.
To initiate the training of the Task’s statistical model, save the settings. This action will redirect you to the Periodic Tasks section. Navigate back to the User Suspicious Behavior Task by clicking on its name in the list. Then, press ‘Run‘ to execute the task and check its status.
There should be no errors. During the first run of the task, it detects no suspicious activity as it solely focuses on training the statistical model. Within the task dialog during the task run, the user can observe the training progress in the status message.
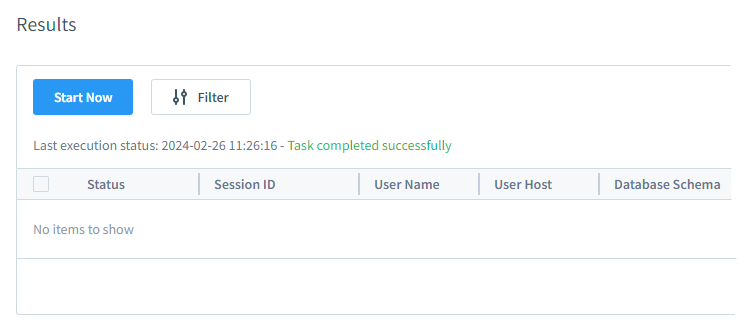
This concludes Step 2. We now have the trained network within the User Suspicious Behavior task and can proceed to actually register the detection of suspicious behavior.
Step 3: Suspicious Activity and Analysis
Suspicious activity in our case involves queries from an unexpected IP address (Malware Activity Host) accessing all fields of the ‘pg_catalog.pg_enum’.
To connect to the arbitrary database from the suspicious IP address of the Malware Activity Host, the ‘psql’ command from that host was used:
/usr/pgsql-13/bin/psql -h 192.168.10.104 -p 5432 -U ubuser01 -d ubdb02
ubdb02=# select * from pg_catalog.pg_enum
As a result, a single session warning appears in the User Suspicious Behavior task results:
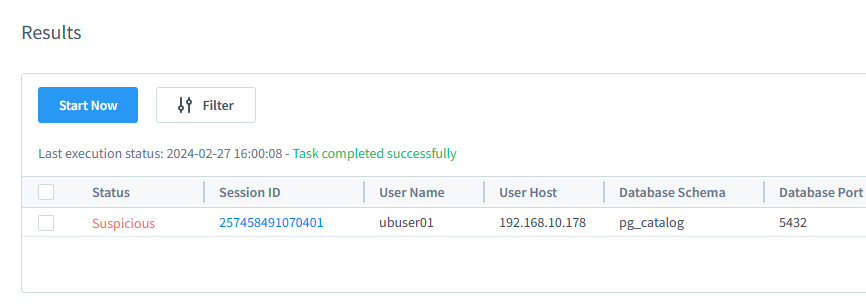
Please note that if the Malware Activity Host user connects to the proxy using software like DBeaver or other database managing UI-based software, this action will also trigger warnings. DBeaver checks the database structure automatically. It executes inquiries on tables and schemas that are not present in the training data. The system may flag unexpected activity as a result.
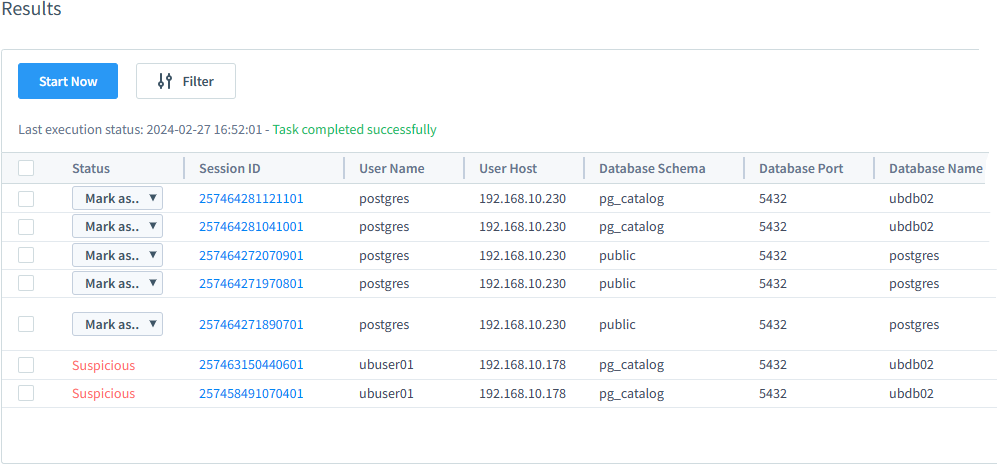
In this scenario, database queries were made twice through the DataSunrise proxy from the Normal Behavior Web-application Host. Subsequently, a connection was established to the database using DBeaver from a trusted IP address. However, DBeaver proceeded to query unusual tables and schemas (pg_catalog). Therefore, we have flagged these sessions as suspected.
The User Suspicious Behavior Task can generate alerts for all proxies of the Audit rule database Instance, or for Rules and Instances if there are many. It’s important to note that in the Results (figure above), the Database Port number represents the port of the database server set in the Instance setup for protected database connection. This is not the Proxy Port of that Instance.
To check if all Instance Proxies are generating suspicious behavior alerts, users should perform suspicious requests on all Proxy Ports, ensure they are audited, and rerun the User Suspicious Behavior Task. Then, click the update icon on the results listing of the task. As new queries appear, click on the Session ID to find the proxy port number.
All queries and the affected rows are available in the Session details when clicked in the task Results table. Please refer to the figure below for more details.
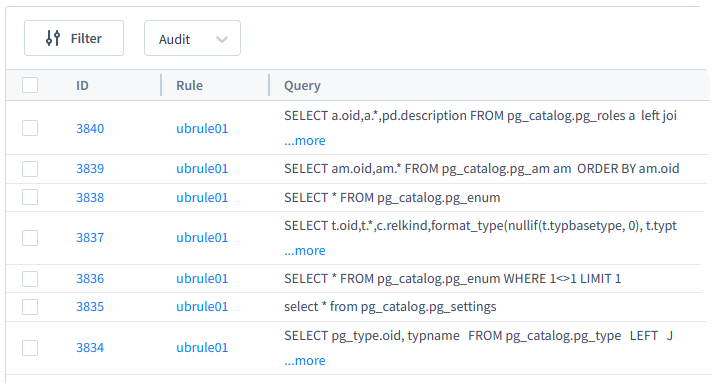
Case Results
We can identify suspicious sessions by examining unusual query parameters such as IP addresses or database names. These parameters deviate from the typical activity seen during training in the User Suspicious Behavior Task.
The main conclusions from the test case are as follows:
- The statistical model focuses on analyzing IP addresses, tables, schemas, etc., within queries. It does not consider the content of the queries themselves. For instance, the statistical model trained on simple SELECT queries will not flag complex SELECT queries or “SELECT all” queries to the same table as suspicious. This is because they originate from appropriate IP addresses and directed to unusual databases.
- Audit Rule Instances determine the potential Proxies for marking incoming sessions as suspicious. It’s crucial for the training dataset to cover all reasonable regular sessions for all Proxies. Unknown Proxy sessions will be flagged as suspicious.
- There is no specific setup required to train the User Suspicious Behavior task on a particular Audit Rule. All transaction records in the audit training set are used to teach the network. These records also help identify new events and send them to the User Suspicious Behavior Task for further investigation.
Troubleshooting
Here, there are a few points to note:
- Use JVMChecker to verify if Java is working properly (located at /opt/datasunrise/bin).
- Utilize User Behavior logs to analyze if the task execution produced any error messages. The User Suspicious Behavior task has a log file for error messages. You can find it in System Settings under Logging & Logs, then Logs Type, and finally User Suspicious Behavior Detection.
- Remember to enable the ‘Audit Objects’ advanced property as the User Behavior Task runs for the first time.
- Understand your data. The training process requires a relatively high amount of data in audit logs. Analyzing the text part of the SQL requests is important to note. This means there will be no alarm for unusual tables or columns in a SELECT request if it was made to the correct database, from the correct IP, and by the correct user and application.
- When running the User Behavior task for the first time, ensure that the Audit Trail contains only whitelisted activity. If needed, the user can easily recreate the User Behavior Task and train its statistical model again.
Conclusion
The ML-based User Suspicious Behavior task helps monitor data access by setting rules for different users automatically. This saves time and effort, especially with large datasets. DataSunrise database firewall effectively leverages ML tools for user behavior monitoring. Despite the underlying complexity of the processes involved, the web-based UI offers a user-friendly interface for setting up tasks and analyzing incoming sessions.
The User Suspicious Behavior task allows you to scan DataSunrise Transactional Trails for any unusual activity from current users. This can help you identify potential security breaches. You can perform this scan regularly or manually. This tool lets users mark sessions as suspicious or normal and make small changes to simplify the interface.
In this article we briefly discussed the User Suspicious Behavior Task setup. Please do not hesitate to visit our website and request an online demo for additional discussion of the DataSunrise database security solutions.
