Audit Guide
The data auditing capability enables real-time database activity monitoring and logging the information about queries reaching the database, such as database content modification, extraction or deletion. DataSunrise provides real-time tracking of database user actions, also monitors changes in database configuration and system settings. In this audit guide, we demonstrate how to configure DataSunrise to audit all queries directed to the target database.

The audit logs are stored in the DataSunrise-integrated SQLite database or in an external database. Logged data helps to comply with requirements of regulatory standards such as SOX, HIPAA, PCI DSS, and other regulators and acts.
Data Audit function is available in Sniffer mode and in Proxy mode. You can create new Data Audit Rules or edit existing ones in the Data Audit section. Rules can be set to audit transaction on a certain database or from certain database users, IP addresses and client applications.
To enhance your understanding of data auditing, we highly recommend visiting our YouTube channel to watch our videos on this topic. These videos not only showcase our auditing solution but also familiarize you with alternative data auditing methods using native DBMS features.
Creating an Audit Rule
Let’s assume that you’ve already created the target database profile. Then to audit our test database, it is necessary to create and configure an Audit Rule. In this case, the sequence of actions is the following:
- Navigate to Audit → Rules. Then click Add Rule to create a new Audit Rule.
- Configure your Audit Rule to log all queries to the database (see notes below).
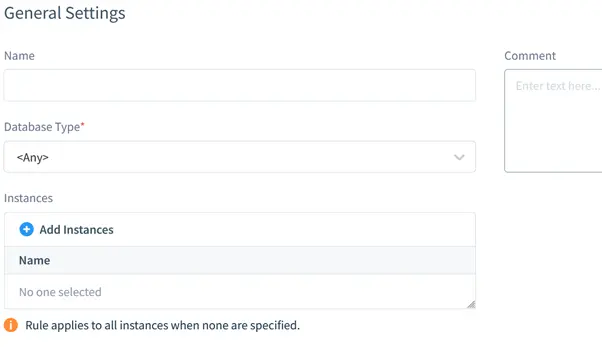
In the Main section subsection, the target database information is specified. It includes database type (PostgreSQL), database instance (as the target database entry is named in the Configurations) and the Rule’s logical name.
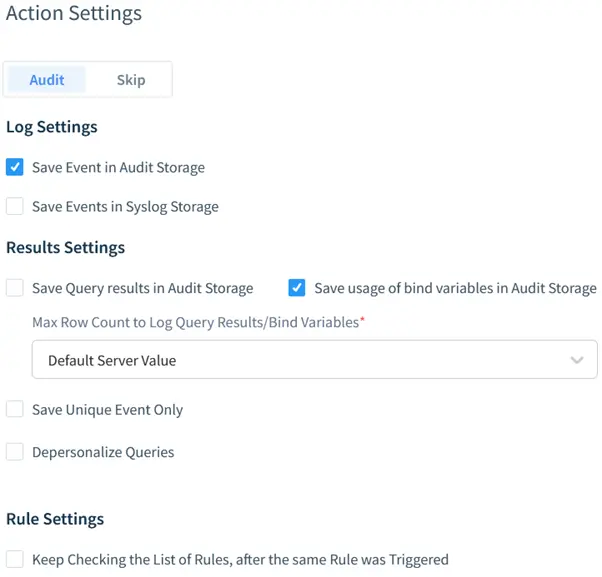
By default, the “Audit” action is selected. It means that DataSunrise will audit user queries when the rule is triggered. To log database responses (the output), the Log Data checkbox is checked.

Since the current scenario requires all user queries to be audited, Filter Sessions are left as by default. Thus, any query to the database regardless of its source IP address will trigger the rule.
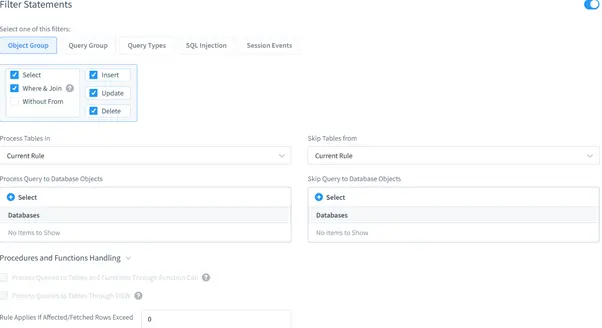
Filter Statements settings are as by default as well. Thus, DataSunrise will audit all queries directed to all database objects.
Viewing Database Audit Results
This stage includes demonstration of auditing results. The Audit Rule which was created at the previous stage is configured to be triggered by any incoming user query. Here’s what happens when DataSunrise receives a user query.
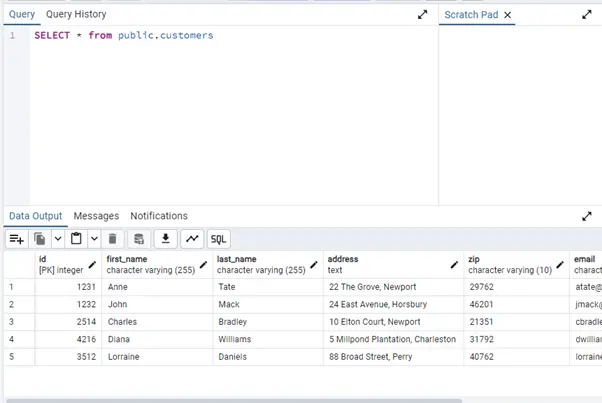
- Let’s send the following query via PGAdmin:
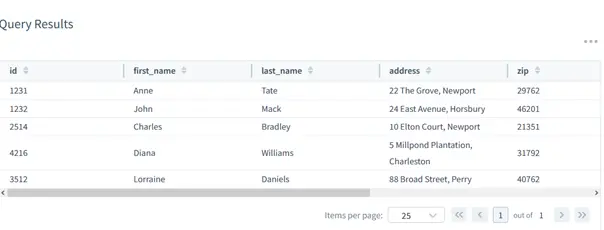
- The database outputs the table contents:
- Now let’s check the auditing results in the DataSunrise’s Web Console. Navigate to the Data Audit → Transactional Trails subsection.
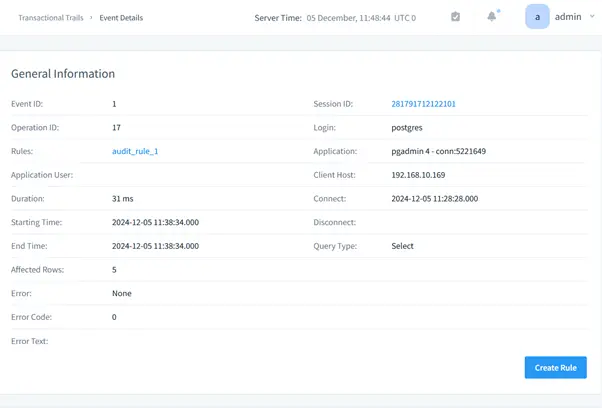
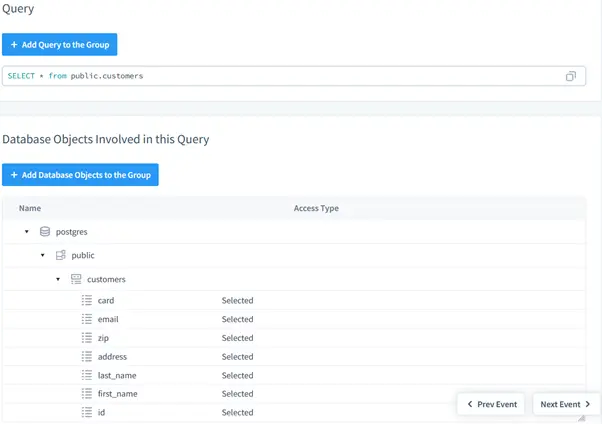
- To view detailed information about some event, click event’s ID. In a new tab, the event’s details will be displayed: code of the query, basic information, session information, database objects involved in the query and the query results.
SELECT * FROM public.customers;
Each event logs comprehensive metadata including IP addresses, application names, timestamps, and execution details.
Scrolling down reveals additional event details, including the complete SQL query statement and database objects the query touches. The query accessed sensitive data fields including credit card numbers, email addresses, and ZIP codes.
Query results can be displayed, but enabling this feature significantly impacts audit database storage consumption.
