Best Practices for AWS OpenSearch Logging
Introduction
All businesses need to quickly search, analyze, and see big data in today’s world, no matter how big they are. AWS OpenSearch, formerly known as Amazon Elasticsearch Service, has emerged as a powerful solution for these needs. Great power also brings great responsibility, particularly for data security and compliance. This is where AWS OpenSearch logging steps in, providing a robust mechanism to monitor and audit your OpenSearch domains.
This article will delve into the intricacies of AWS OpenSearch logging, exploring its importance, implementation, and best practices. Whether you’re experienced or new to AWS, this guide will help you use OpenSearch logging effectively.
What is AWS OpenSearch?
Before we dive into logging, let’s briefly touch on what AWS OpenSearch is. AWS OpenSearch is a managed service that makes it easy to deploy, operate, and scale OpenSearch clusters in the AWS Cloud. It provides a powerful search and analytics engine capable of handling large volumes of data in near real-time.
Understanding AWS OpenSearch Logging
The Essence of OpenSearch Logging
At its core, AWS OpenSearch logging is a feature that allows you to monitor and audit activities within your OpenSearch domains. It provides detailed information about various operations, including:
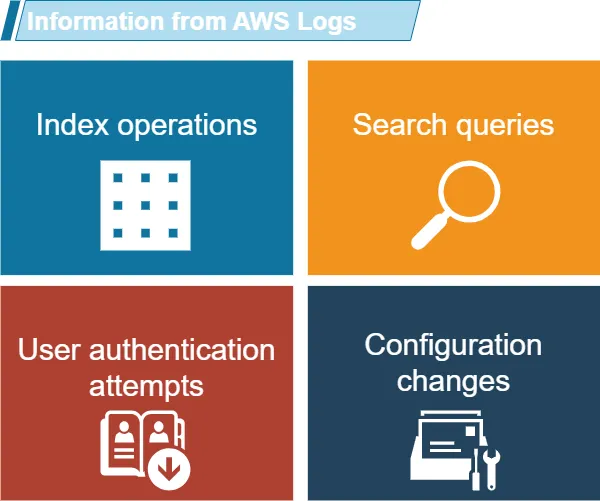
This logging capability is crucial for maintaining data security, troubleshooting issues, and ensuring compliance with various regulations.
Types of Logs in AWS OpenSearch
AWS OpenSearch offers several types of logs:
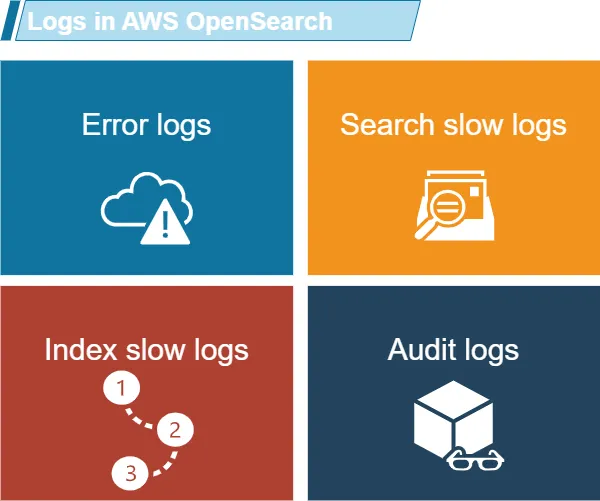
Each of these log types serves a specific purpose, providing insights into different aspects of your OpenSearch domain’s performance and security.
Implementing AWS OpenSearch Logging
Setting Up Error Logs
Error logs are essential for identifying and resolving issues in your OpenSearch domain. Here’s how you can enable them:
- Navigate to the AWS OpenSearch Service console
- Select your domain
- Click on the “Logs” tab
- Enable “Error logs” and choose a CloudWatch log group
Example:
aws opensearch update-domain-config --domain-name my-domain --log-publishing-options "ErrorLogEnabled=true,CloudWatchLogsLogGroupArn=arn:aws:logs:us-west-2:123456789012:log-group:/aws/opensearch/domains/my-domain/error-logs"
After enabling, you might see logs like:
[2023-07-02T12:00:00,000][ERROR][o.e.b.ElasticsearchUncaughtExceptionHandler] fatal error in thread [main]
java.lang.OutOfMemoryError: Java heap space
This indicates a potential memory issue that needs addressing.
Configuring Slow Logs
Slow logs help identify performance bottlenecks. To set them up:
- In the OpenSearch Service console, select your domain
- Go to the “Slow logs” section
- Enable both search and index slow logs
- Set appropriate thresholds
Example configuration:
PUT _cluster/settings
{
"transient": {
"search.slowlog.threshold.query.warn": "10s",
"search.slowlog.threshold.fetch.warn": "1s",
"indexing.slowlog.threshold.index.warn": "10s"
}
}
This sets warning thresholds for slow queries and indexing operations.
AWS OpenSearch Audit Logging
Importance of Audit Logging
Audit logging is a critical aspect of AWS OpenSearch logging, particularly for data security and compliance. It provides a detailed record of user activities, helping you monitor who accessed what data and when.
Enabling Audit Logging
To enable audit logging:
- Go to the AWS OpenSearch Service console
- Select your domain and click “Edit”
- In the “Fine-grained access control” section, enable audit logging
- Choose the audit log events you want to capture
Example configuration:
PUT _plugins/_security/api/audit/config
{
  "enabled": true,
  "audit": {
    "enable_rest": true,
    "disabled_rest_categories": [
      "AUTHENTICATED",
      "GRANTED_PRIVILEGES"
    ],
    "enable_transport": true,
    "disabled_transport_categories": [
      "AUTHENTICATED",
      "GRANTED_PRIVILEGES"
    ],
    "resolve_bulk_requests": true,
    "log_request_body": true,
    "resolve_indices": true,
    "exclude_sensitive_headers": true
  }
}
This configuration enables comprehensive audit logging, excluding some less critical events to reduce log volume.
OpenSearch Data Security
Leveraging Logs for Enhanced Security
AWS OpenSearch logging plays a crucial role in maintaining data security. By analyzing logs, you can:
- Detect unauthorized access attempts
- Identify potential data breaches
- Monitor user activities
Best Practices for Opensearch Security
To maximize the security benefits of logging:
- Regularly review audit logs
- Set up alerts for suspicious activities
- Use log data for compliance reporting
Example alert setup using CloudWatch:
aws cloudwatch put-metric-alarm \
--alarm-name "UnauthorizedAccessAttempts" \
--alarm-description "Alarm when there are multiple unauthorized access attempts" \
--metric-name "UnauthorizedAccessCount" \
--namespace "AWS/ES" \
--statistic "Sum" \
--period 300 \
--threshold 5 \
--comparison-operator GreaterThanThreshold \
--dimensions Name=DomainName,Value=my-domain \
--evaluation-periods 1 \
--alarm-actions arn:aws:sns:us-west-2:123456789012:SecurityAlerts
This sets up an alarm that triggers when there are more than 5 unauthorized access attempts within 5 minutes.
Advanced Logging Techniques
Analyze Logs with OpenSearch Dashboards
OpenSearch Dashboards (formerly Kibana) provides powerful visualization capabilities for your logs. To set it up:
- Access OpenSearch Dashboards through the AWS console
- Create an index pattern matching your log indices
- Build visualizations and dashboards
Example query to visualize slow queries:
GET opensearch_dashboards_sample_data_logs/_search
{
  "size": 0,
  "aggs": {
    "slow_queries": {
      "range": {
        "field": "response.duration",
        "ranges": [
          { "from": 1000 }
        ]
      }
    }
  }
}
This query aggregates all requests that took longer than 1 second.
Integrating with AWS CloudTrail
For a more comprehensive audit trail, integrate OpenSearch logging with AWS CloudTrail:
- Enable CloudTrail in your AWS account
- Configure CloudTrail to log OpenSearch API calls
- Analyze CloudTrail logs alongside OpenSearch logs
Troubleshooting Common Logging Issues
Missing Logs
If you’re not seeing expected logs:
- Check if logging is enabled for the specific log type
- Verify IAM permissions for log delivery
- Ensure the CloudWatch log group exists and has correct permissions
High Log Volume
If you’re generating too many logs:
- Adjust log levels (e.g., increase slow log thresholds)
- Use log filters to focus on important events
- Use log aggregation tools for efficient data analytics
Example CloudWatch Logs Insights query to identify high-volume log sources:
fields @timestamp, @message
| stats count(*) as count by bin(30m)
| sort count desc
| limit 10
This query shows the top 10 30-minute periods with the highest log volume.
Summary and Conclusion
AWS OpenSearch logging is a powerful tool for maintaining the security, performance, and compliance of your OpenSearch domains. You can learn a lot about your website or system by using error logs, slow logs, and audit logs. Error logs, slow logs, and audit logs provide valuable information on the performance of your website or system. By analyzing these logs, you can identify issues and make improvements to enhance the overall functionality.
Remember these key points:
- Enable comprehensive logging for your OpenSearch domains
- Regularly review and analyze your logs
- Use logs for security monitoring and compliance reporting
- Integrate with other AWS services like CloudTrail for a holistic view
- Optimize your logging strategy to balance insight with resource usage
By following these practices, you can effectively use AWS OpenSearch to its fullest potential while ensuring strong security and performance.
For user-friendly and flexible tools for database security, audit, and compliance, consider exploring DataSunrise’s offerings. Visit our website at datasunrise.com for an online demo and to learn how we can enhance your data protection strategy.