Top Data Analytics Tools for Better Decision-Making

Introduction
In today’s fast-paced, data-driven business environment, organizations are collecting and storing massive amounts of data. Large-scale data is important information that helps companies make better decisions, improve operations, and stay ahead of competitors. However, to unlock the full value of vast amounts of data, organizations need powerful data analytics tools and solutions.
This article will explain the basics of data analytics tools, including Big Data, popular analysis tools, and open-source solutions. We will explore the advantages of using these tools and help you pick the best solution for your organization. You will understand how these tools can help your organization use data to achieve success.
What is Big Data?
Organizations collect a substantial amount of data, known as Big Data, from sources such as social media, sensors, and transactional systems. This data is often too large and complex for traditional data processing tools to handle effectively. The three main characteristics of large-scale data are:
- Volume: The sheer amount of data being collected and stored.
- Velocity: The rate of data production and processing.
- Variety: The diverse types of data, including structured, semi-structured, and unstructured data.
Organizations require advanced data analytics tools to extract value from large volumes of data. These tools help process and analyze large amounts of information quickly and efficiently. These tools help companies find patterns and trends in their data, giving important insights for making strategic decisions.
The Importance of Big Data Analytics
Big Data analytics has become increasingly crucial for organizations across various industries. By leveraging the power of data, companies can:
- Improve customer understanding: Analyze customer behavior, preferences, and feedback to develop targeted marketing strategies and personalized experiences.
- Optimize operations: Identify inefficiencies, streamline processes, and reduce costs by analyzing operational data.
- Enhance risk management: Detect and prevent fraud, monitor compliance, and mitigate risks by analyzing financial and transactional data.
- Drive innovation: Stay ahead of competitors by studying market trends and customer needs. Use this information to find new opportunities and create new products and services.
As data grows in size and complexity, utilizing advanced data analytics becomes more crucial. Organizations need to invest in the right tools and solutions to keep up with this trend.
Data Analysis Tools
Data analysis tools are software applications that help organizations process, visualize, and interpret their data. These tools can range from simple spreadsheet applications to complex, enterprise-level solutions. Some popular data analyzing tools include:
- Microsoft Excel: Excel is a widely used program for creating pivot tables and charts to analyze data. Effective for small data sets and basic analyses, but may struggle with larger, more complex data sets. For example, to make a pivot table in Excel, just choose your data, go to the “Insert” tab, and click “PivotTable”.
- Tableau: Tableau is easy to use for making interactive dashboards and reports without requiring programming knowledge. It connects to different data sources, making it easy for users to explore and analyze their data.
- Python: Python is a common programming language for analyzing data. It has libraries like NumPy, Pandas, and Matplotlib that help with data manipulation, statistical analysis, and machine learning projects. Example:
- R: A statistical programming language widely used in academia and industry for data analysis and machine learning. R provides a wide range of packages for data manipulation, visualization, and statistical modeling. Example:
- Apache Spark: An open-source, distributed computing system that can process large datasets across clusters of computers. Spark provides APIs in Java, Scala, Python, and R, making it accessible to a wide range of users. Example: To use Spark for data processing, you’ll need to set up a Spark cluster and write code using one of the supported APIs. Here’s a simple example using PySpark:
import pandas as pd
data = pd.read_csv('sales_data.csv')
total_sales = data['revenue'].sum()
print(f"Total sales: ${total_sales:.2f}")
This Python code uses the Pandas library to read a CSV file containing sales data, calculates the total sales, and prints the result.
library(ggplot2)
data <- read.csv("sales_data.csv")
ggplot(data, aes(x = product, y = revenue)) +
  geom_bar(stat = "identity", fill = "steelblue") +

  labs(title = "Sales by Product", x = "Product", y = "Revenue")
This R code uses the ggplot2 package to create a bar chart visualizing sales revenue by product.
from pyspark.sql import SparkSession
spark = SparkSession.builder.appName("SalesAnalysis").getOrCreate()
data = spark.read.csv("sales_data.csv", header=True, inferSchema=True)
total_sales = data.agg({"revenue": "sum"}).collect()[0][0]

print(f"Total sales: ${total_sales:.2f}")
This PySpark code reads a CSV file, calculates the total sales, and prints the result.
These tools can perform basic tasks such as exploring data and creating charts. They can also handle more advanced tasks like analyzing statistics and utilizing machine learning. By using these tools, organizations can better understand their data and make smarter decisions.
Open-Source Data Analytics Solutions
Free open-source data analytics tools that offer powerful capabilities are available, in addition to commercial options. Some popular open-source data analytics solutions include:
- Apache Hadoop: A system that stores and processes large amounts of data across multiple groups of basic hardware. Hadoop consists of two main components: HDFS (Hadoop Distributed File System) for storage and MapReduce for processing. Example: To analyze data with Hadoop, you can write MapReduce jobs in Java or use tools like Hive or Pig. Here’s a simple example of a MapReduce job that counts the occurrences of each word in a text file:
- Kibana: Kibana is a complimentary tool compatible with Elasticsearch. It enables users to visualize their data through interactive dashboards. Users can create graphs, maps, and tables, and filter data in real-time.
- PostgreSQL: A powerful, open-source relational database management system that supports advanced data analytics capabilities, such as window functions and recursive queries. PostgreSQL has a reputation for its reliability, performance, and extensibility. Example:
public class WordCount {
  public static class TokenizerMapper extends Mapper<Object, Text, Text, IntWritable> {
    private final static IntWritable one = new IntWritable(1);
    private Text word = new Text();
    public void map(Object key, Text value, Context context) throws IOException, InterruptedException {
      StringTokenizer itr = new StringTokenizer(value.toString());
      while (itr.hasMoreTokens()) {
        word.set(itr.nextToken());
        context.write(word, one);
      }
    }
  }
  public static class IntSumReducer extends Reducer<Text, IntWritable, Text, IntWritable> {
    private IntWritable result = new IntWritable();
    public void reduce(Text key, Iterable<IntWritable> values, Context context) throws IOException, InterruptedException {
      int sum = 0;
      for (IntWritable val : values) {
        sum += val.get();
      }
      result.set(sum);
      context.write(key, result);
    }
  }
  public static void main(String[] args) throws Exception {
    Configuration conf = new Configuration();
    Job job = Job.getInstance(conf, "word count");
    job.setJarByClass(WordCount.class);
    job.setMapperClass(TokenizerMapper.class);
    job.setCombinerClass(IntSumReducer.class);
    job.setReducerClass(IntSumReducer.class);
    job.setOutputKeyClass(Text.class);
    job.setOutputValueClass(IntWritable.class);
    FileInputFormat.addInputPath(job, new Path(args[0]));
    FileOutputFormat.setOutputPath(job, new Path(args[1]));
    System.exit(job.waitForCompletion(true) ? 0 : 1);
  }
}
This Java code defines a MapReduce job that counts the occurrences of each word in a text file. The mapper tokenizes the input text and emits (word, 1) pairs, while the reducer sums the counts for each word.
To create a dashboard in Kibana, first go to the “Dashboard” tab. Then, click on “Create new dashboard.” Finally, add visualizations by clicking on “Add.” You can personalize and save the dashboard for future use.
SELECT
  product_id,
  SUM(quantity) AS total_quantity,
  SUM(price * quantity) AS total_revenue
FROM sales
GROUP BY product_id
ORDER BY total_revenue DESC
LIMIT 10;
This SQL query calculates the total quantity and revenue for each product. It then arranges the results by revenue and displays the top 10 products.
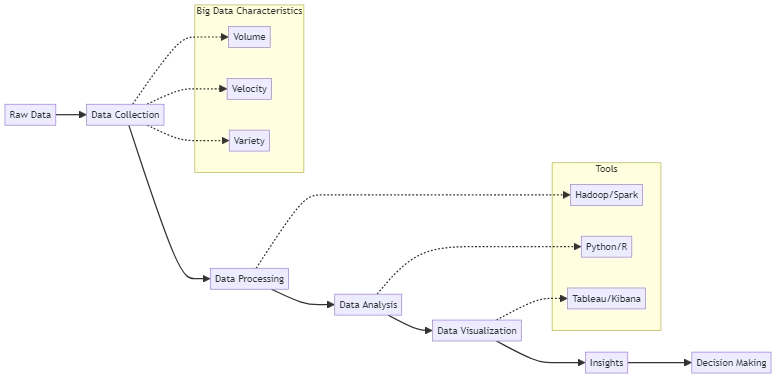
Data Analytics Process
These open-source solutions provide organizations with flexible, scalable, and cost-effective options for analyzing their extensive datasets. By leveraging these tools, companies can gain valuable insights without the need for expensive commercial licenses.
Benefits of Using Data Analytics Tools
Investing in data analytics tools offers numerous benefits for organizations, including:
- Improved decision-making: These tools help organizations make better decisions by providing insights based on data.
- Increased efficiency: Data analytics tools automate and streamline data processing and analysis tasks, saving time and resources.
- Enhanced customer understanding: Analyzing customer data helps organizations better understand their target audience, enabling more effective marketing and personalization strategies.
- Competitive advantage: Leveraging data analytics tools allows organizations to identify trends, opportunities, and risks before their competitors, providing a strategic edge.
- Cost savings: By optimizing operations, reducing waste, and identifying areas for improvement, data analytics tools can help organizations reduce costs and increase profitability.
As data grows, using analytics tools becomes more important for organizations to stay competitive in a data-driven world.
Choosing the Right Data Analytics Tool
Choosing the right data analytics tool for your organization can be difficult because of the many options available. When evaluating different options, consider the following factors:
- Scalability: Can the tool handle the volume, velocity, and variety of your data? Make sure the solution you choose can scale to meet your current and future needs.
- Ease of use: Is the tool user-friendly and accessible to non-technical users? Consider the learning curve and whether the tool provides intuitive interfaces and visualizations.
- Integration: Does the tool integrate with your existing data sources and systems? Ensure that the solution can seamlessly connect to your data infrastructure and workflows.
- Cost: What is the total cost of ownership, including licensing, hardware, and maintenance? Consider both upfront and ongoing costs when evaluating different options.
- Community and support: Is there an active community and reliable support for the tool? A strong user community and responsive support can be invaluable when implementing and using a data analytics solution.
To find the best data analytics tool for your organization, assess your needs and compare different options. This will help you maximize your data’s potential.
Conclusion
Data analytics tools are essential for organizations looking to harness the power of Big Data. By leveraging these tools, companies can gain valuable insights, make data-driven decisions, and improve their overall performance.
When you begin your data analytics journey, it’s important to understand your goals. You should also consider the different options available to you. As you gain more knowledge, be prepared to adjust your approach accordingly. By doing this, you will be able to fully use your data and help your organization succeed.