
Data Audit in PostgreSQL

Introduction: The Expanding Necessity for Effective Data Audit
The importance of data auditing cannot be overstated, especially for industries governed by strict security standards, such as finance, healthcare, and e-commerce. With regulations like GDPR and HIPAA, organizations must ensure robust audit capabilities to safeguard sensitive data and maintain compliance. Without proper auditing, businesses risk heavy fines and reputational damage, particularly in the face of rising cyber threats. Comprehensive audit mechanisms are crucial for meeting these security requirements and avoiding costly violations.
Did you know that, according to an IBM report, the global average cost of a data breach in 2024 increased 10% to the highest total of $4.88M? This stark reality underscores the importance of robust, comprehensive audit trails.
Database auditing is a cornerstone for monitoring user activities, identifying suspicious behavior, and ensuring adherence to compliance mandates. PostgreSQL is a widely trusted database system known for its reliability, offering essential auditing features designed to address basic compliance needs. In this article, we’ll provide a step-by-step guide on configuring basic data audit in PostgreSQL using these built-in capabilities. Additionally, we’ll explore alternative tools and approaches for addressing more advanced data audit in PostgreSQL requirements.
Data Audit in PostgreSQL with Native Capabilities
PostgreSQL provides several built-in options for auditing database activities. These features are versatile but may require manual configuration for advanced use cases. Below, we outline one of the simplest and most commonly used methods: logging SQL queries with the log_statement parameter.
Using PostgreSQL Logging (log_statement)
One of the easiest ways to audit database activity in PostgreSQL is by enabling query logging. The log_statement parameter allows you to capture SQL queries executed on the database, which can then be stored in a log file for analysis.
1. Locate PostgreSQL configuration file
To enable query logging, you need to modify the postgresql.conf configuration file. If you’re unsure where this file is located, you can find its path by running the following command:
sudo -u postgres psql -c "SHOW config_file;"This command will output the location of the configuration file, such as:
/etc/postgresql/16/main/postgresql.conf

Make sure you have the necessary permissions to edit this file. If you’re using a non-default superuser account, replace "postgres" in the command with your username.
2. Configure postgresql.conf
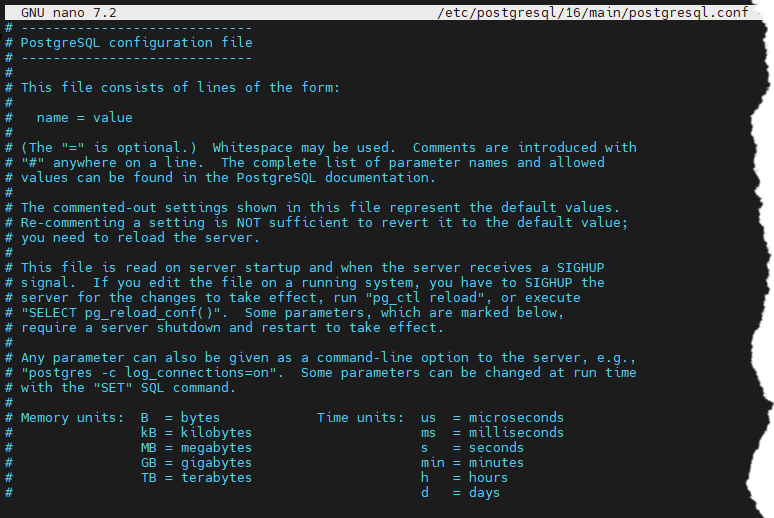
Once you’ve located the postgresql.conf file, open it in a text editor (e.g., nano or vim) and add or modify the following lines to enable auditing:
# Enable logging of SQL statements
log_statement = 'all'  # Options: 'none', 'ddl', 'mod', 'all'
# Log the duration of each completed statement
log_duration = on
# Log detailed statistics for SQL statements (parsing, planning, execution)
log_statement_stats = on
# Log when a new connection is made
log_connections = on
# Log when a connection is terminated
log_disconnections = on
# Log queries taking longer than 1000 ms (adjust as needed)
log_min_duration_statement = 1000
# Configure log file directory and naming
log_directory = '/var/log/postgresql'
log_filename = 'postgresql-%Y-%m-%d_%H%M%S.log'
# Optional: Rotate log files when they reach 10MB
log_rotation_size = 10MB
Understanding PostgreSQL log_statement Options
The log_statement parameter controls which types of SQL statements are logged. Depending on your needs, you can select one of the following options:
none: No SQL statements are logged. This is the default setting.ddl: Logs Data Definition Language (DDL) statements such asCREATE,ALTER, andDROP. Useful for tracking schema changes.mod: Logs DDL statements and data-modifying (DML) statements likeINSERT,UPDATE, andDELETE. Ideal for monitoring data changes without logging every query.all: Logs all SQL statements, includingSELECT. Best for comprehensive auditing but may generate large log files.
3. Restart PostgreSQL to apply changes
After making changes to the postgresql.conf file, restart PostgreSQL for the new settings to take effect
# For Linux systems
sudo systemctl restart postgresql
# For macOS using Homebrew
brew services restart postgresql
4. Check PostgreSQL logs
Once the changes are applied, you can run some SQL queries in your database and navigate to the directory specified in the log_directory setting (e.g., /var/log/postgresql) to see the queries recorded inside .log files.
To view the most recent log entries, use the following command:
tail -f /var/log/postgresql/postgresql-*.logIf you have customized the log location in the settings, replace the default path with your configured log file path.
This will display real-time logs of the queries being executed, along with their execution times, connection events, and any errors. For example, in the screenshot below, the query SELECT * FROM data_test WHERE id = 1 is successfully logged, showing the statement itself, the duration it took to execute, and other additional information.

Beyond Basics: Advanced Data Audit in PostgreSQL
While PostgreSQL offers basic auditing through its native logging features, these capabilities are often limited in scope, lacking advanced filtering, session tracking, and object-specific monitoring. Performance can also degrade when handling high data volumes or additional parameters. To address more advanced audit requirements, users may turn to custom solutions like audit tables and triggers or extensions like pgAudit. However, these approaches still depend on PostgreSQL’s logging framework, which can be challenging to scale and manage as databases grow.
DataSunrise for PostgreSQL Auditing: A Comprehensive Solution
For businesses requiring more robust and scalable solutions, third-party tools like DataSunrise seamlessly address these gaps. These solutions not only enhance auditing functionality but also offer advanced features like real-time alerts, data masking, and compliance reporting, delivering a comprehensive and efficient alternative tailored for modern data security needs.
Here’s a quick overview of how to achieve a similar setup to ‘log_statement = all’ using DataSunrise
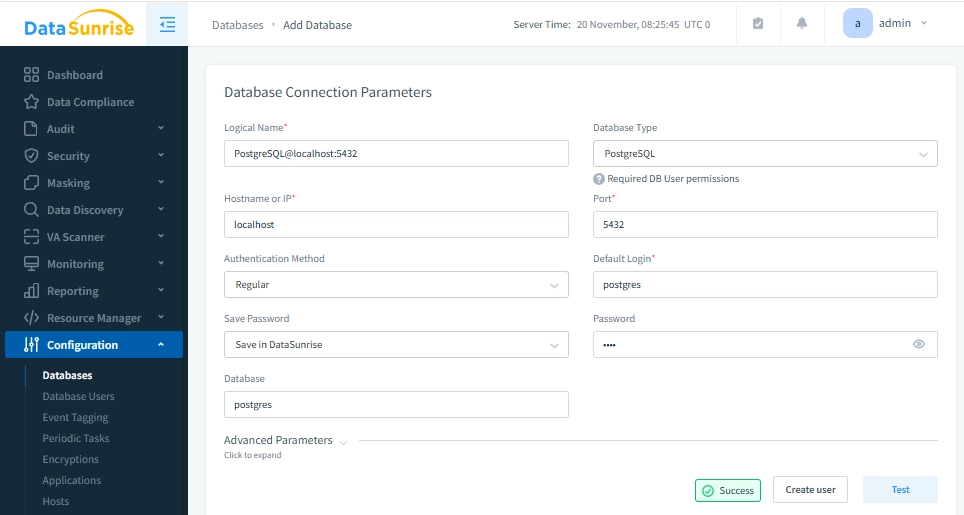
1. Connecting a Database Instance to DataSunrise
Set up a PostgreSQL instance in DataSunrise by providing connection details (host, port, username, password, database). This enables monitoring and auditing of all database interactions.
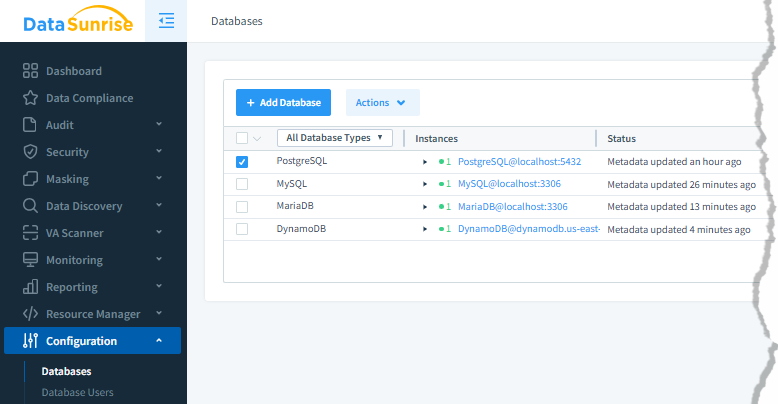
Once the connection is established, your newly added database instance will appear in the list. You can connect multiple PostgreSQL databases, or even different types of databases, as DataSunrise supports a wide range of database platforms.
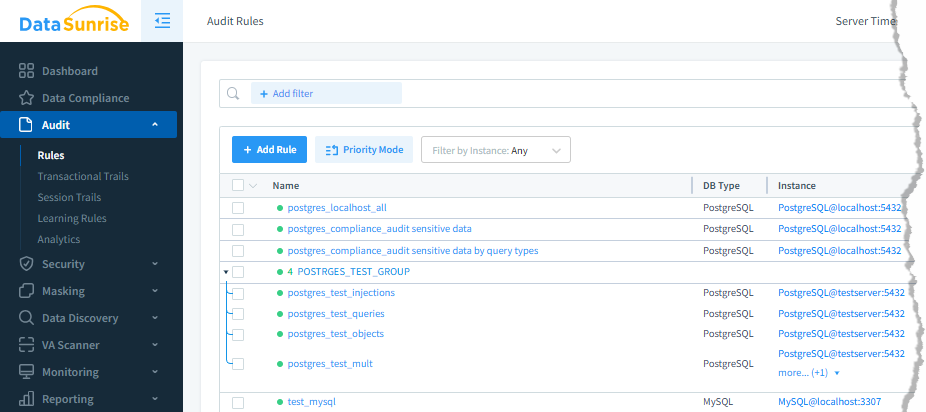
2. Setting Up an Audit Rule
In DataSunrise, similar to the log_statement = all setup in the previous section, you can configure a rule to log all queries or set up multiple filters to track different actions.
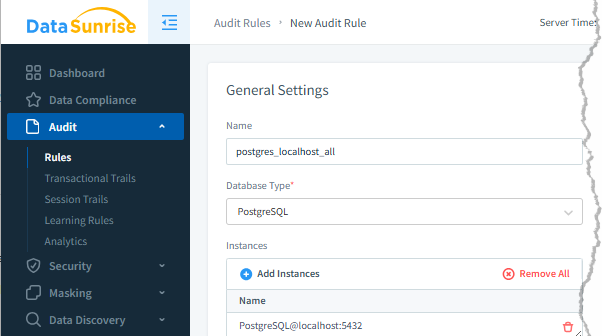
You can create and manage multiple rules with various filters, enabling or disabling them as you need — all through a simple and convenient user interface.
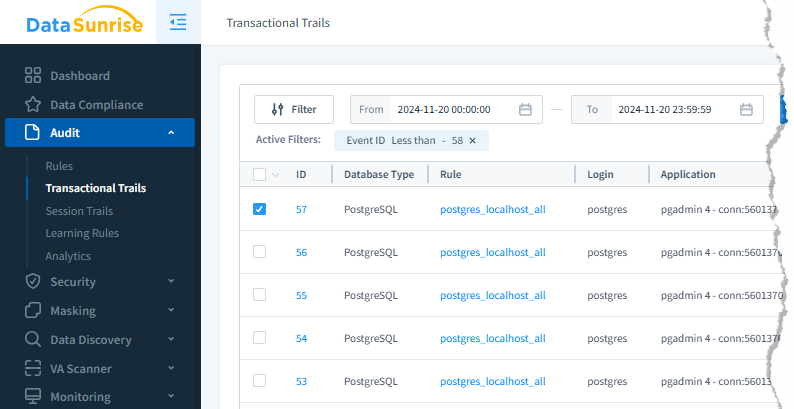
3. Checking the Audit Trails
Once the rules are active, you can access the audit logs to review detailed activity reports, including the user who performed the action and any changes made. Filters make it easy to search for and monitor specific events.
Key Benefits of Implementing Full-Scale Enterprise Solutions
Extensive Audit Options: Define precise rules to monitor specific database actions (e.g., SELECT, DDL), offering far more flexibility than PostgreSQL’s native logging.
Regulatory Compliance: Generate automated reports to meet standards like GDPR, HIPAA, and PCI DSS, ensuring proper compliance.
User-Friendly Interface: Simplify auditing with an intuitive dashboard that streamlines setup, configuration, and log management.
Enhanced Data Security: Protect sensitive information with advanced features like data masking and encryption.
Real-Time Alerts: Receive immediate notifications for suspicious activities, enabling quick responses to potential threats.
Detailed Reporting: Access in-depth, customizable reports for better insights into database activity and security.
Scalability: Easily adapt to growing business needs with enterprise-ready auditing capabilities.
Conclusion
Data audit in PostgreSQL is essential for safeguarding data and ensuring regulatory compliance. While PostgreSQL provides native auditing features, more extensive solutions like DataSunrise offer enhanced capabilities with flexible, feature-rich environment for comprehensive database activity monitoring.
Effective data auditing is a continuous process, not a one-time effort. Continuously monitoring, regularly updating strategies, and utilizing the right tools are essential for maintaining a secure and compliant database environment.
DataSunrise provides user-friendly and versatile tools for data audit in PostgreSQL as well as database security, data masking, data discovery, and many others. Explore our solutions with an online demo to see how they can enhance your auditing capabilities.
