
Database Audit in PostgreSQL: Native Logging vs. Advanced Security with DataSunrise
Introduction: The Price of Database Integrity and Accountability
In today’s data-driven landscape, the stakes for securing sensitive information have never been higher. Organizations in finance, healthcare, e-commerce, and beyond are under constant pressure to comply with regulations such as GDPR, CCPA, and HIPAA. Compliance isn’t just a buzzword; it’s a necessity to avoid fines, mitigate risks, and maintain customer trust.
Did you know that since the introduction of the General Data Protection Regulation (GDPR) in 2018, fines have exceeded a staggering $4.9 billion by April 2024? This averages over $1 million in penalties daily for violations such as insufficient security or lack of transparency. These hefty penalties further illustrate the critical importance of maintaining robust database audit capabilities.
PostgreSQL, an open-source relational database management system renowned for being one of the most flexible and reliable, comes equipped with a range of built-in tools designed for auditing. This article will explore how database audit in PostgreSQL can be implemented using those native logging capabilities. Also, near the end, we'll examine how database audit in PostgreSQL using built-in tools compares to DataSunrise solutions that address their limitations.
Database Audit in PostgreSQL with Built-In tools
1. log_statement
Setup and Usage
The log_statement parameter in PostgreSQL allows you to log SQL statements based on their type (DDL, DML, or SELECT). It's configured in the postgresql.conf file or via an SQL command.
Steps to Enable:
- Edit the
postgresql.conffile:You can use
"SHOW config_file"query to get the location of this file. Once it’s open, update these lines:log_statement = 'all' # Options: 'none', 'ddl', 'mod', 'all' log_directory = 'pg_log' # Directory for log files log_filename = 'postgresql-%Y-%m-%d_%H%M%S.log' # File name setting Restart PostgreSQL for the changes to take effect:
sudo systemctl restart postgresqlOpen the log file for viewing or continuous real-time monitoring using this command:
Substitute the file location in the example with your actual file name and pathtail -f /var/log/postgresql-2024-11-25.log
You can also set it temporarily via SQL:
SET log_statement = 'all';
Query Example: Once configured, running a query like:
SELECT * FROM users WHERE id = 1;

Will result in a log entry similar to one on the screenshot below:

Use Case: This basic setup provides visibility into all executed SQL queries, helping with auditing and debugging.
2. pg_stat_statements
Setup and Usage
pg_stat_statements is an extension available in PostgreSQL by default that tracks query performance metrics. It must be explicitly enabled.
Steps to Enable:
Add the
pg_stat_statementsextension to your PostgreSQL instance:CREATE EXTENSION pg_stat_statements;Update the
postgresql.conffile to load the module:shared_preload_libraries = 'pg_stat_statements' pg_stat_statements.track = allReload PostgreSQL:
sudo systemctl restart postgresql
Query Example: To view query statistics:
SELECT query, calls, total_exec_time, mean_exec_time
FROM pg_stat_statements
ORDER BY total_exec_time DESC
LIMIT 5;
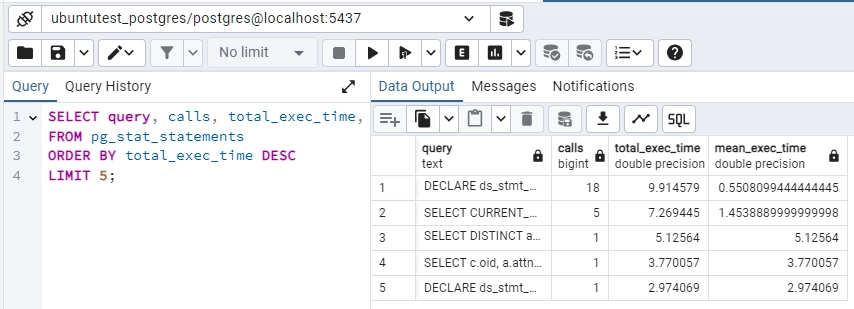
This query lists the top 5 queries with the highest total execution time, helping to identify slow or frequently used queries.
Use Case: Perfect for auditing long-term query performance and optimizing frequently executed queries.
3. pg_stat_activity
Setup and Usage
pg_stat_activity is a system view that displays information about current database sessions, including running queries, client addresses, and connection states.
Steps to Enable: No special configuration is required, as it's enabled by default.
Query Example: To monitor active sessions:
SELECT pid, usename, client_addr, state, query, query_start
FROM pg_stat_activity
WHERE state = 'active';

This query outputs details of all active queries:
pid: Process ID of the session.application_name: The application used to establish the connection.usename: Username of the connected user.client_addr: IP address of the client.state: State of the connection (e.g.,active,idle).query: The SQL query being executed.query_start: Timestamp of when the query began.
Use Case: This is useful for real-time monitoring of long-running or potentially problematic queries.
4. Triggers
Setup and Usage
Triggers in PostgreSQL are database objects that execute a specified function automatically when certain events (INSERT, UPDATE, DELETE) occur on a table.
Steps to Create a Basic Trigger:
Create audit table
CREATE TABLE audit_table
(old_data JSONB, new_data JSONB, action TEXT, changed_at TIMESTAMPTZ);
Write a trigger function:
CREATE OR REPLACE FUNCTION audit_log()
RETURNS TRIGGER AS $$
BEGIN
INSERT INTO audit_table (old_data, new_data, action, changed_at)
VALUES (row_to_json(OLD), row_to_json(NEW), TG_OP, now());
RETURN NEW;
END;
Create a trigger to use the function:
CREATE TRIGGER user_changes_audit
AFTER INSERT OR UPDATE OR DELETE ON users
FOR EACH ROW EXECUTE FUNCTION audit_log();
Query Example: When a row in the users table is updated:
UPDATE users SET lastname = 'New' WHERE id = 1;
The audit_table would capture the change:

Use Case: Triggers are highly flexible and can record detailed data-level and schema-level changes, making them essential for fine-grained auditing.
Addressing Native Database Audit in PostgreSQL Limitations with DataSunrise Solutions
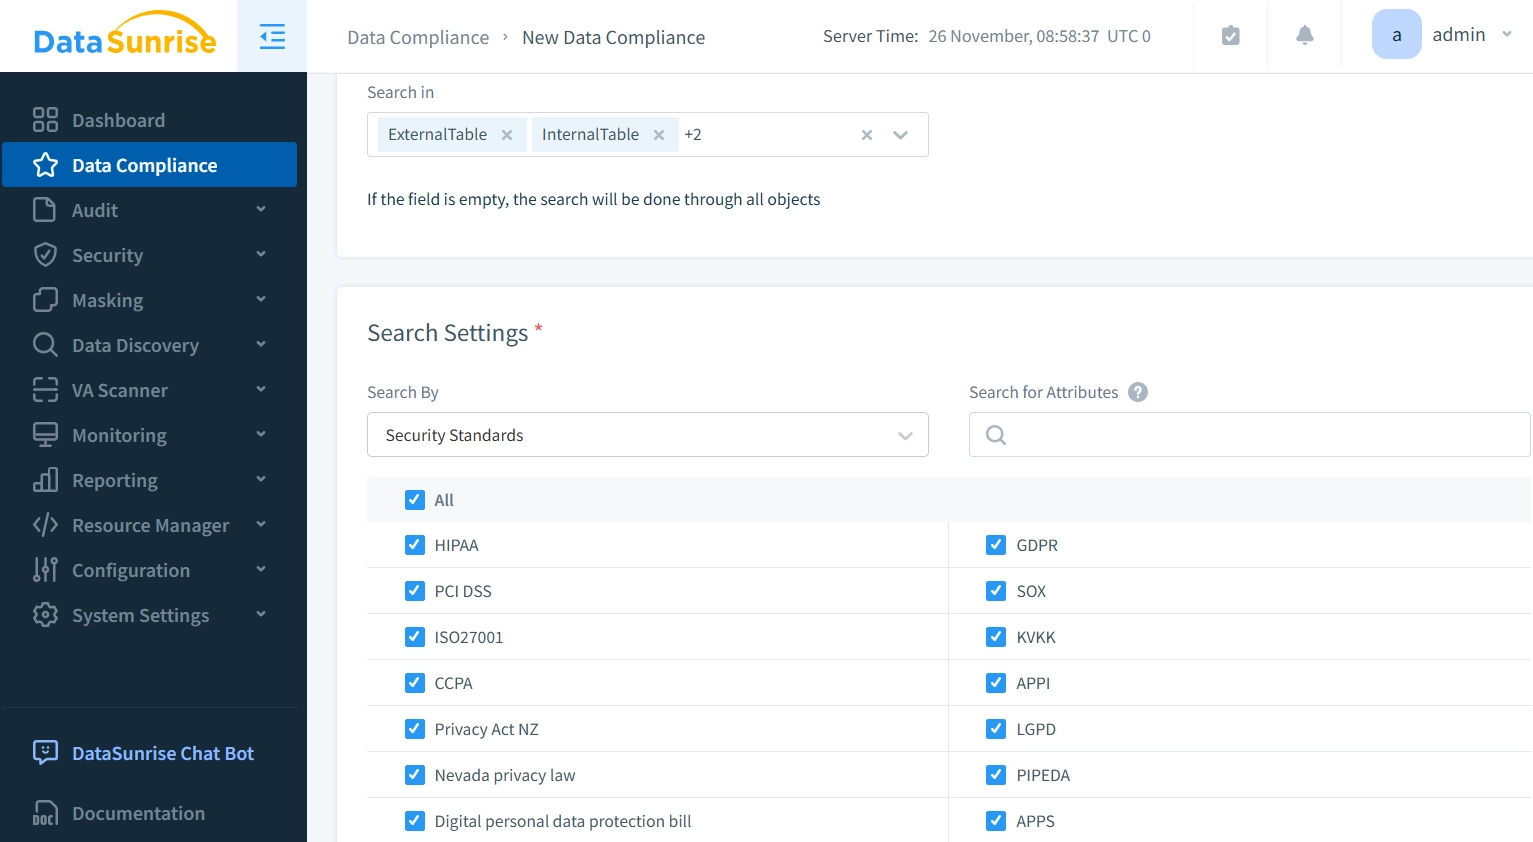
1. Automated Compliance Support
- Limitation: PostgreSQL logs require significant manual effort to interpret for compliance with GDPR, HIPAA, PCI-DSS
- DataSunrise automates compliance reporting by formatting audit data into pre-built reports aligned with major regulatory standards, reducing manual workloads and ensuring accuracy.
2. Real-Time Awareness
- Limitation: PostgreSQL can record events through logs and triggers but lacks real-time alerts for critical incidents like unauthorized access or SQL injections.
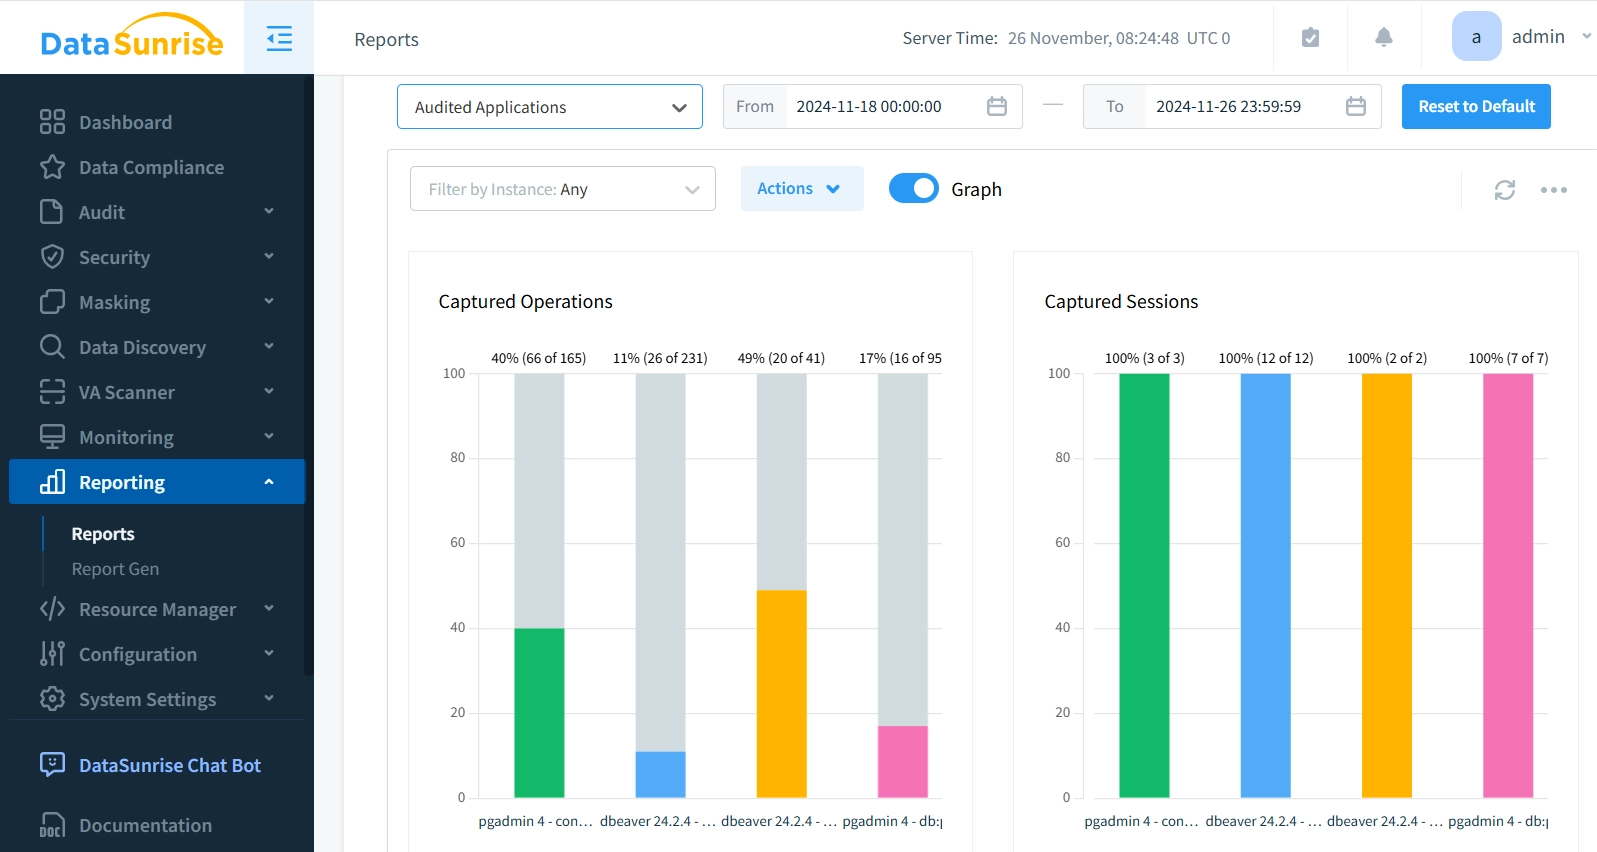
- DataSunrise bridges this gap by monitoring database traffic in real-time, detecting unusual activities, and immediately notifying administrators via configured channels like email or Slack. This proactive approach ensures swift action against potential threats.
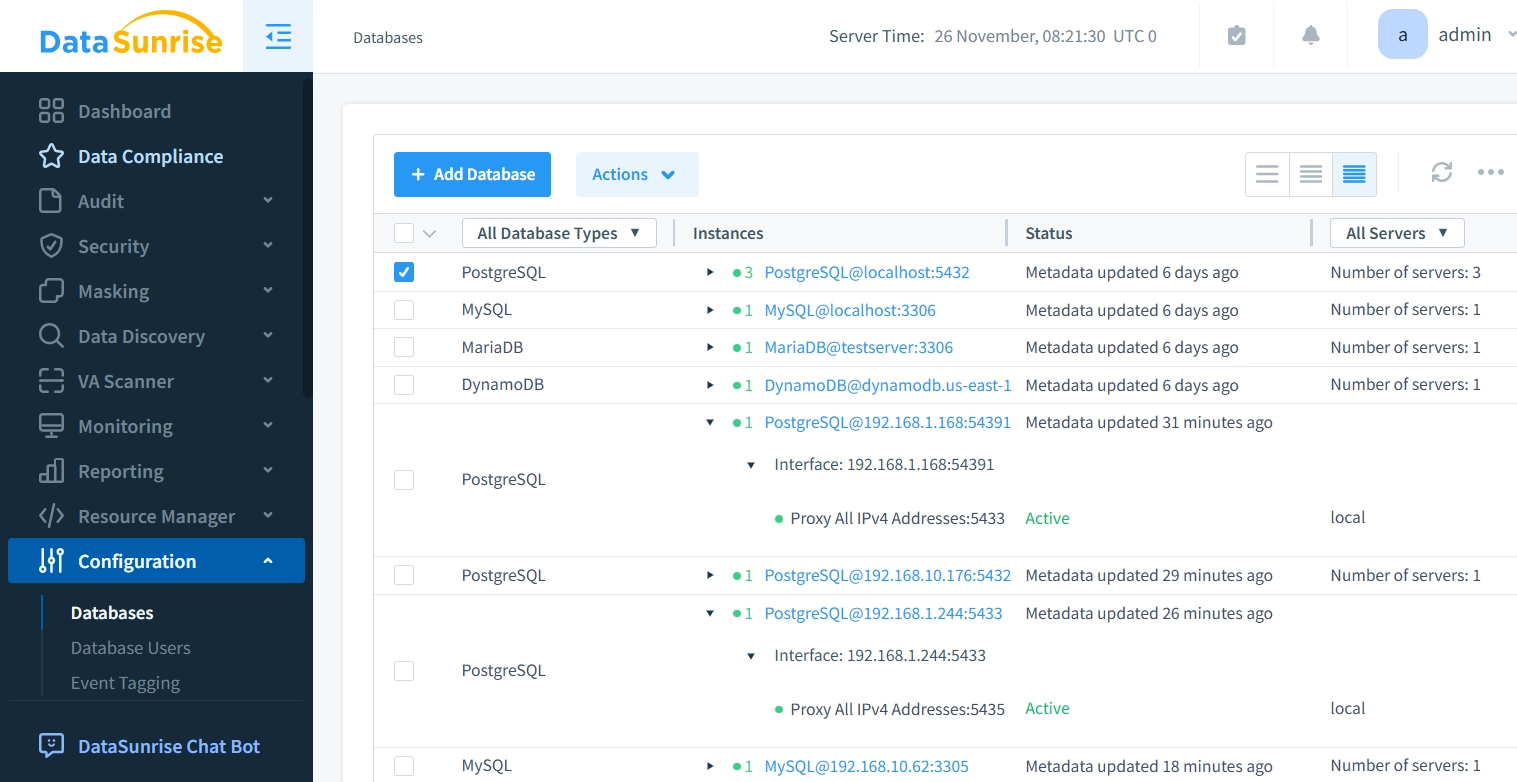
3. Unified Log Management
- Limitation: PostgreSQL stores logs per database instance, making cross-system log correlation difficult.
- DataSunrise centralizes logs into a single platform from PostgreSQL and over 40 other supported database engines, simplifying event correlation and enabling quick anomaly detection across systems."
4. Session History and User Tracking
- Limitation: PostgreSQL tools like
pg_stat_activitytrack only active or idle sessions, with no history of already terminated connections. - DataSunrise maintains a complete record of all user sessions, including terminated ones, supporting retrospective investigations and activity analysis.
5. Comprehensive Audit Rules and Filtering
- Limitation: While PostgreSQL triggers can be configured for auditing, they might require complex maintenance and lack unified management of audit rules across different security levels.
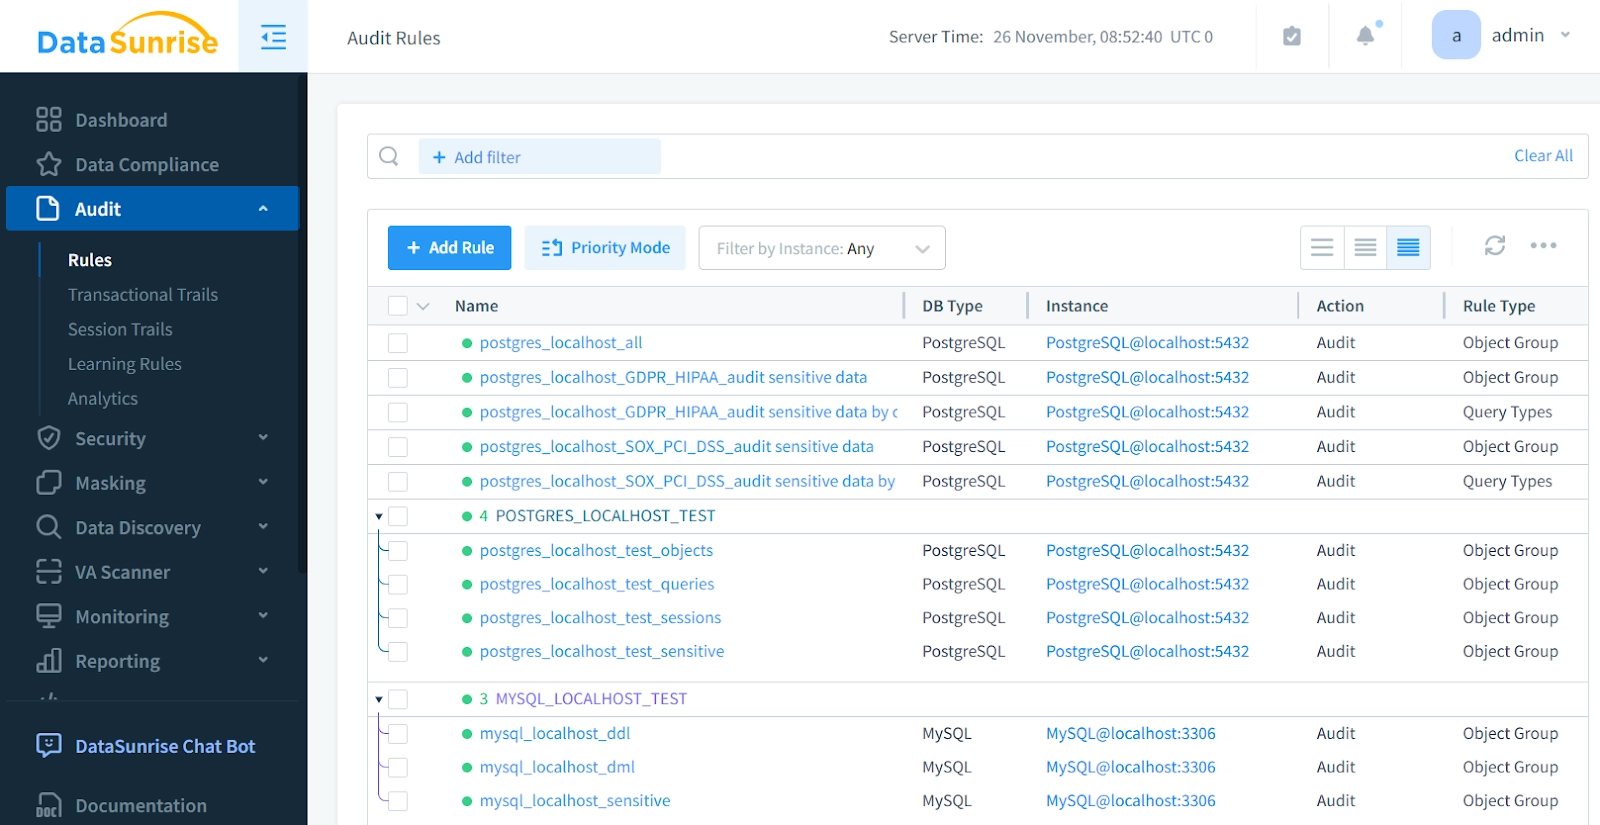
- DataSunrise offers flexible multi-level audit rules – from session and object access to specific query patterns. All audit trails and security events are monitored through a single interface, eliminating the need for complex trigger management and providing granular control over what gets logged and how.
6. Enhanced Versatility and Features
- Limitation: PostgreSQL’s built-in features often require extensions or customizations for advanced security and compliance needs.
- DataSunrise enhances database oversight with AI-driven data search, multi-database support, real-time monitoring, automated report generation, and additional enterprise-grade features, providing scalable and streamlined management for diverse environments.
Conclusion:
Effective database auditing is more than a regulatory checkbox—it's a cornerstone of modern data management. Database audit in PostgreSQL using native capabilities, such as log_statement, pg_stat_statements, and triggers, can provide a solid starting point for monitoring database activities. However, these tools come with limitations require careful setup and can impact performance if not configured properly.
DataSunrise excels precisely here, offering advanced auditing features out-of-the-box that are both easy to manage and optimized for performance. From real-time notifications of suspicious activities to automated compliance reporting and comprehensive events and session tracking, DataSunrise enhances database auditing to meet the demands of today’s stringent regulatory landscape.
Explore our solutions with an online demo to see how they can enhance your auditing capabilities.
