
Elasticsearch Data Audit Trail

Introduction
Modern technology now enables powerful full-text search engines with advanced visualization capabilities on your desktop. Organizations handling sensitive information must maintain a vigilant eye on their data access and modifications. This is where Elasticsearch data audit trail comes into play. It’s a powerful tool that tracks and records database activities, providing a comprehensive view of who accessed what data and when.
Did you know that 60% of data breaches are caused by internal threats? This startling statistic underscores the importance of robust audit trails in modern data management systems. Let’s dive into the world of Elasticsearch data audit trails and explore how they can fortify your data security measures.
Understanding Elasticsearch Data Audit Trail
What is Elasticsearch?
Elasticsearch is a distributed, open-source search and analytics engine. It’s designed for horizontal scalability, reliability, and real-time search capabilities. Many organizations use Elasticsearch for log analytics, full-text search, and business intelligence.
The Importance of Audit Trails
Audit trails are crucial for maintaining data integrity and security. They provide a chronological record of system activities, helping to detect unauthorized access, track changes, and ensure compliance with regulatory requirements.
Enabling Audit Trail in Self-Hosted Elasticsearch
Trial Mode for Audit Capability
It’s important to note that the audit capability in free Elasticsearch is available as a trial feature. To experience its full potential, you’ll need to enable the 30-day trial with API or config file. This allows you to see the audit trail in action and evaluate its benefits for your organization.
Step-by-Step Guide to Enable Audit Trail
I downloaded and extracted Elasticsearch 8.15.2 to my Windows Desktop. I verified sufficient free disk space, as Elasticsearch may fail on the first run with limited storage (less than 10 GB). The elasticsearch start
Let’s walk through the process of enabling and using the audit trail feature in Elasticsearch. We’ll use a script that pauses between actions, allowing you to review each step carefully.
- Launch Elasticsearch by running the elasticsearch.bat file located in the bin directory of your extracted folder (e.g., C:\Users\user\Desktop\elasticsearch-8.15.2-windows-x86_64\elasticsearch-8.15.2\bin). Note the Elastic user password displayed in the startup output. If missed, you can generate a new one.
- Create a new batch file with a descriptive name in your preferred directory.
- Copy the following script into the file:
@echo off

:: Set Elasticsearch URL and credentials.
:: Find the password (ES_PASS) in the first launch output.
set ES_URL=https://localhost:9200
set ES_USER=elastic
set ES_PASS=0IC-UMdBZH*euILO3OVw
set INDEX_NAME=my_new_index

echo Creating new index...
curl -X PUT -u %ES_USER%:%ES_PASS% -k "%ES_URL%/%INDEX_NAME%"
pause

echo Enabling trial license...
curl -X POST -u %ES_USER%:%ES_PASS% -k "%ES_URL%/_license/start_trial?acknowledge=true"
pause

echo Creating a sample document...
curl -X POST -u %ES_USER%:%ES_PASS% -H "Content-Type: application/json" -d "{\"title\":\"Sample Document\",\"content\":\"This is a sample document for testing purposes.\",\"timestamp\":\"%DATE% %TIME%\"}" -k "%ES_URL%/%INDEX_NAME%/_doc"
pause

echo Retrieving all documents in the index...
curl -X GET -u %ES_USER%:%ES_PASS% -k "%ES_URL%/%INDEX_NAME%/_search?pretty"
pause

echo All operations completed.- Replace ES_PASS value with your actual Elasticsearch password.
- Save the file and run it by double-clicking or executing it from the command prompt.
This script will enable the trial license, create a test index, add a sample document, and retrieve all documents. Between each action, it pauses, allowing you to review the output.
Configuring Audit Settings
To fully enable auditing, you’ll need to modify the Elasticsearch configuration file. Follow these steps:
- Locate your elasticsearch.yml file in the Elasticsearch config directory.
- Add the following lines to the end of the file:
xpack.security.audit.enabled: true
xpack.security.audit.logfile.events.include: "_all"
- Save the .yml file and restart Elasticsearch to apply the changes. To restart Elasticsearch hold Ctrl+C in it’s console and then answer Y on the question if you really want to exit. Then run elasticsearch.bat script again.
Analyzing Audit Logs
Once auditing is enabled, Elasticsearch will generate logs of all system activities.
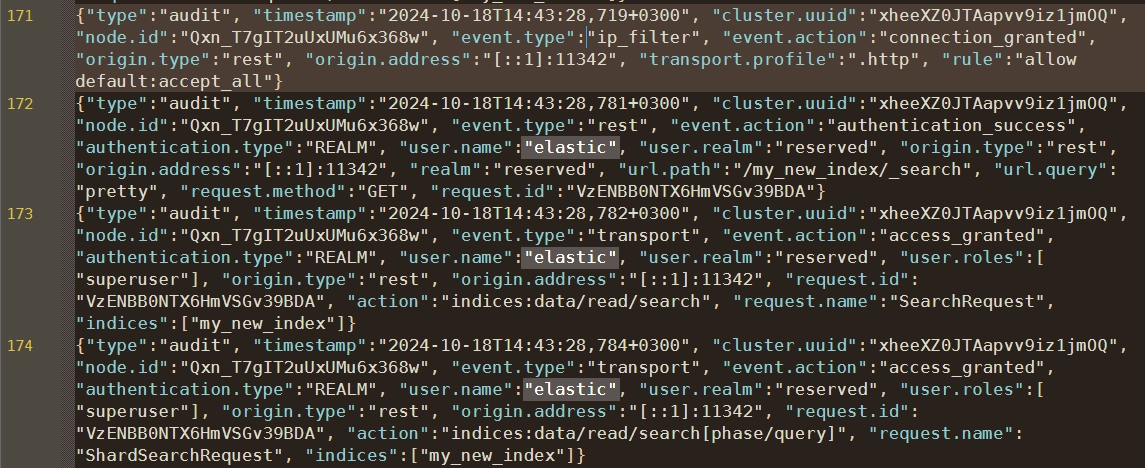
The search request was made to “/my_new_index/_search” with the “pretty” query parameter. And the request method was GET. System access originated from the local node (127.0.0.1:9300). But the user access came from [::1]:11342, indicating a localhost IPv6 connection.
These log events generated by running this script (curl is installed in Windows machine):
@echo off

:: Set Elasticsearch URL and credentials
:: Find the password (ES_PASS) in first Elasticsearch launch output
set ES_URL=https://localhost:9200
set ES_USER=elastic
set ES_PASS=0IC-UMdBZH*euILO3OVw
set INDEX_NAME=my_new_index

echo Retrieving all documents in the index...
curl -X GET -u %ES_USER%:%ES_PASS% -k "%ES_URL%/%INDEX_NAME%/_search?pretty"
pause

echo All operations completed.
This simple data access script outputs json data to console and triggers the audit events mentioned before.
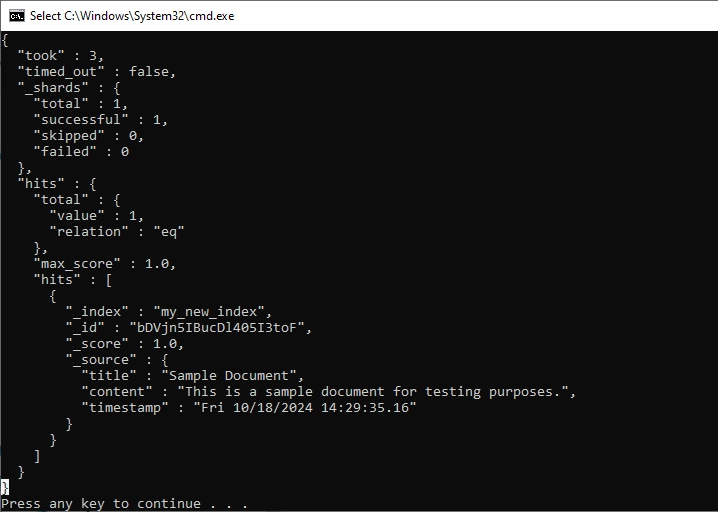
The logs can be analyzed using Elasticsearch’s powerful search capabilities or visualized using tools like Kibana.
Limitations of Elasticsearch Audit Trail
While Elasticsearch’s audit trail feature is robust, it does have some limitations. Configuration options are somewhat limited compared to specialized audit solutions. It focuses primarily on Elasticsearch operations, not providing comprehensive database security features.
Enhancing Security with DataSunrise
For organizations seeking more comprehensive database security solutions, DataSunrise offers a powerful alternative. DataSunrise provides a range of features that go beyond basic audit trails:
- Five operation modes for flexible deployment
- Web-based UI for easy management
- LLM-based security assistant for intelligent threat detection
- Multi-database support for diverse environments
While DataSunrise is a paid solution, its extensive feature set and user-friendly interface make it a valuable investment for organizations prioritizing data security.
DataSunrise Workflow
The following screenshots demonstrate Elasticsearch data auditing. We create an Instance for the Elasticsearch server we’ve launched.
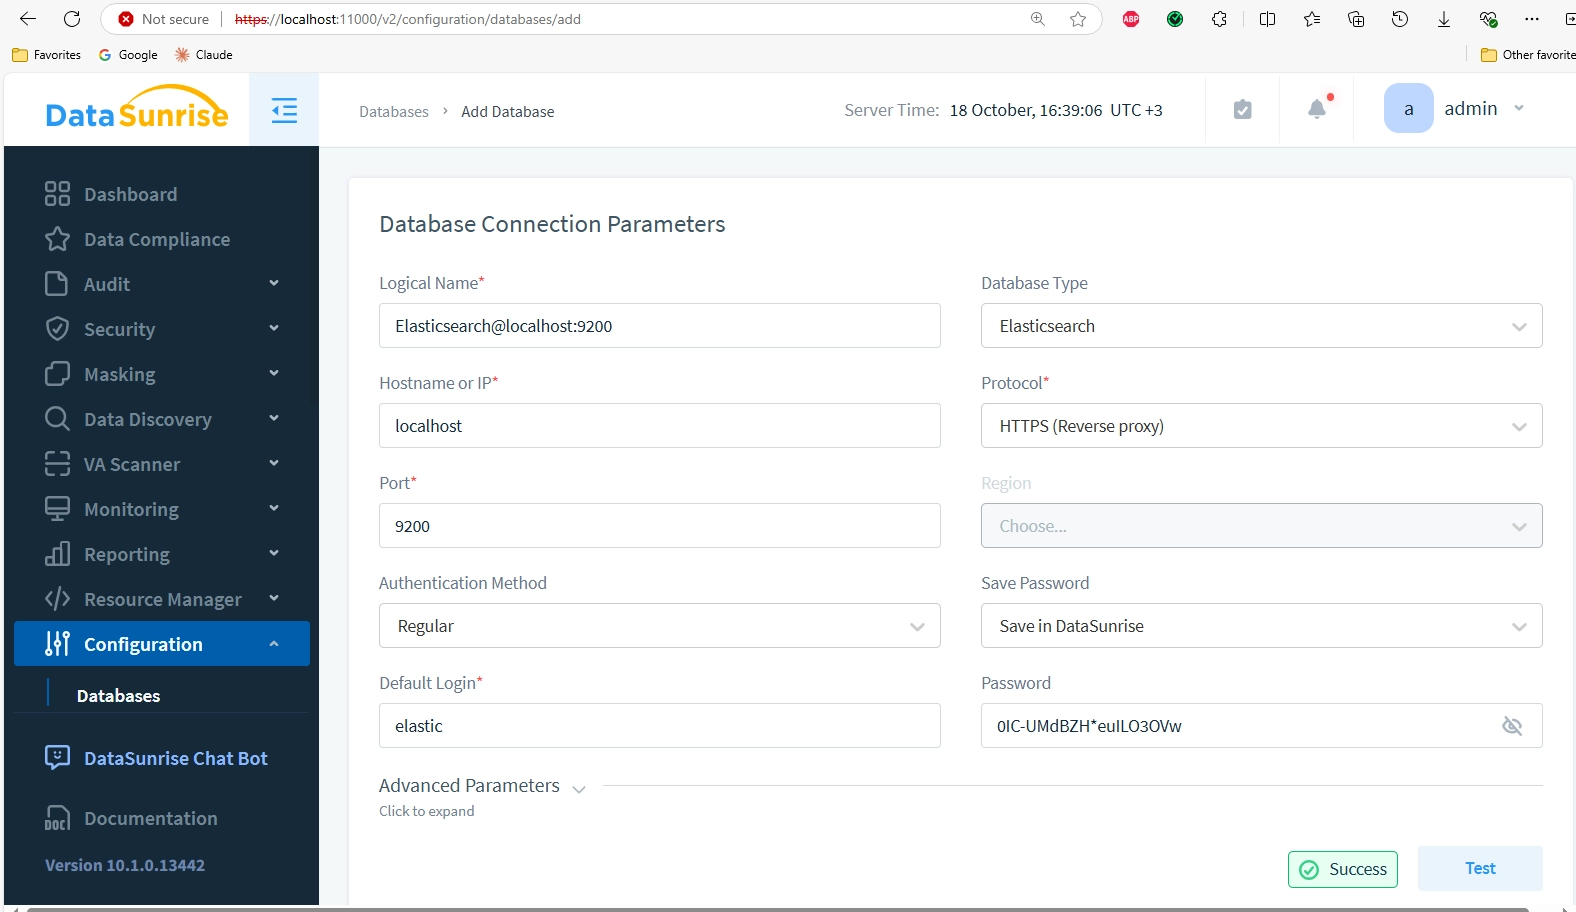
In this example, the proxy is set to the adjacent port number 9201.

Next, we create an Audit Rule to capture queries. No objects are specified in the filter, and we’ve enabled saving of query results (checkbox).
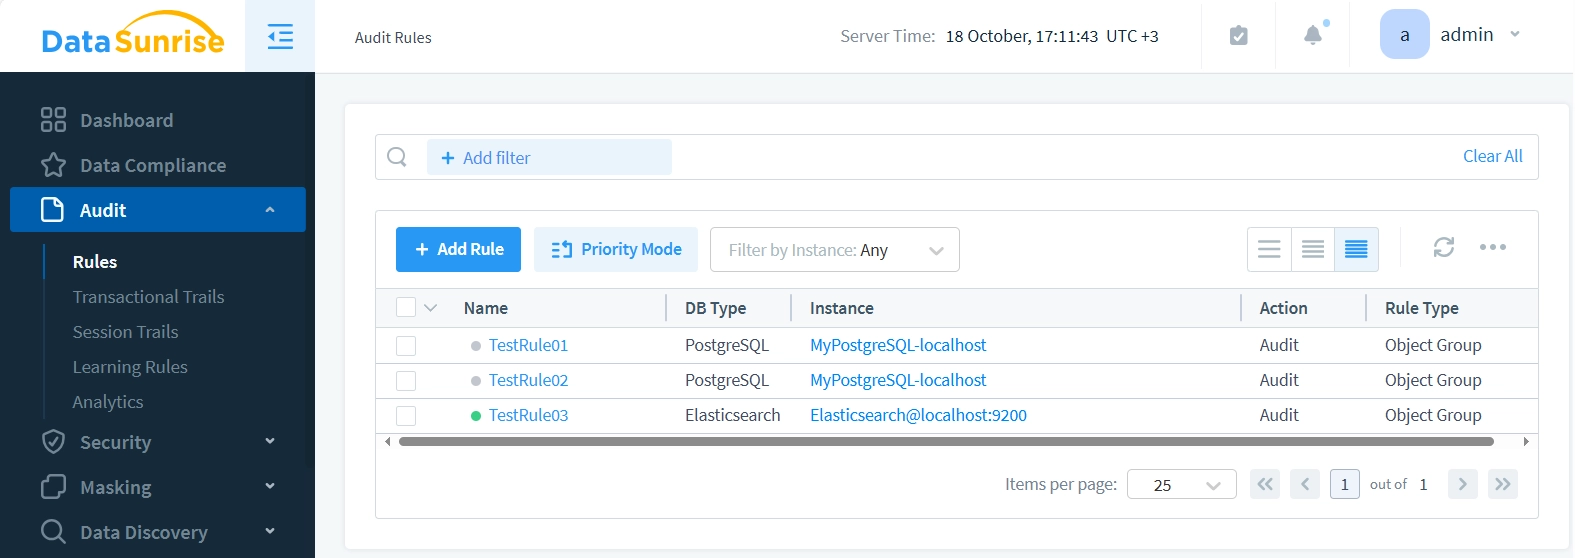
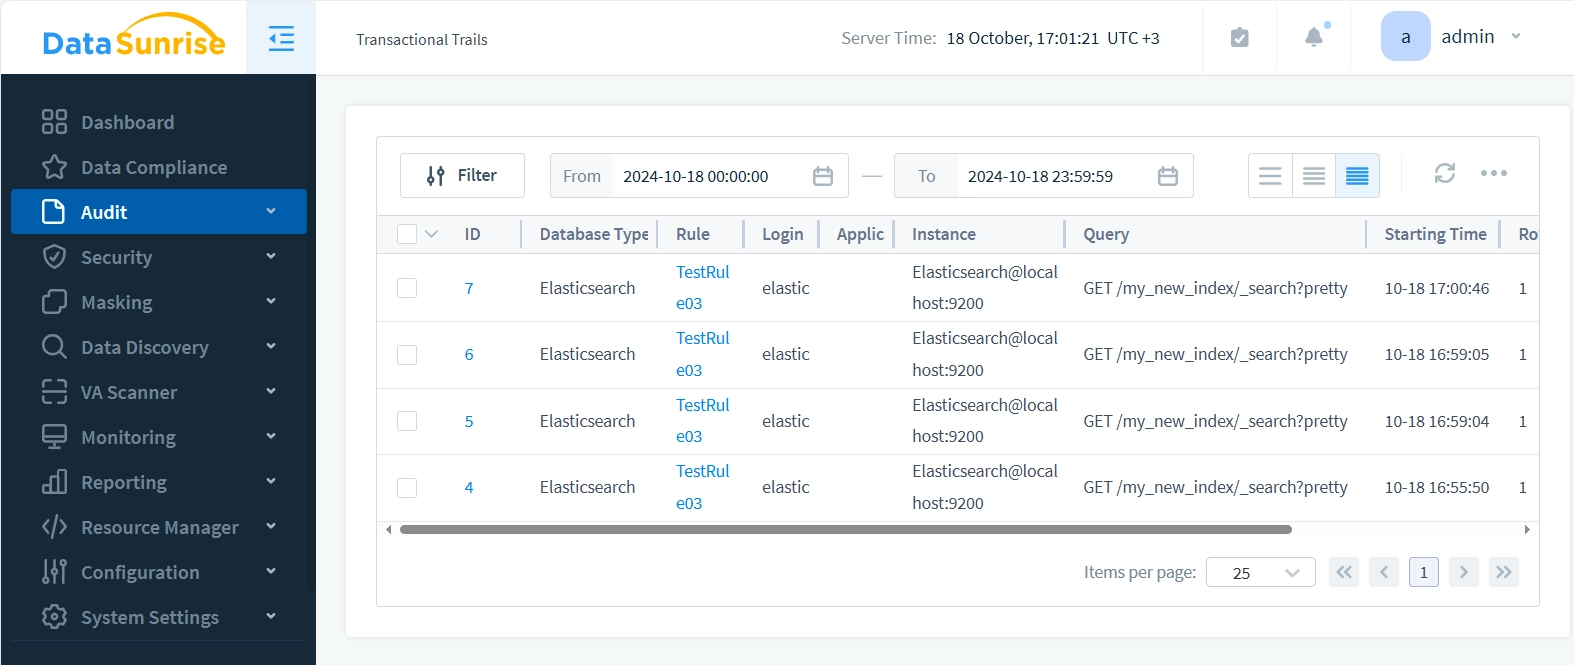
We make several requests, changing ES_URL from https://localhost:9200 to https://localhost:9201. The Transactional Trails now appear as follows:
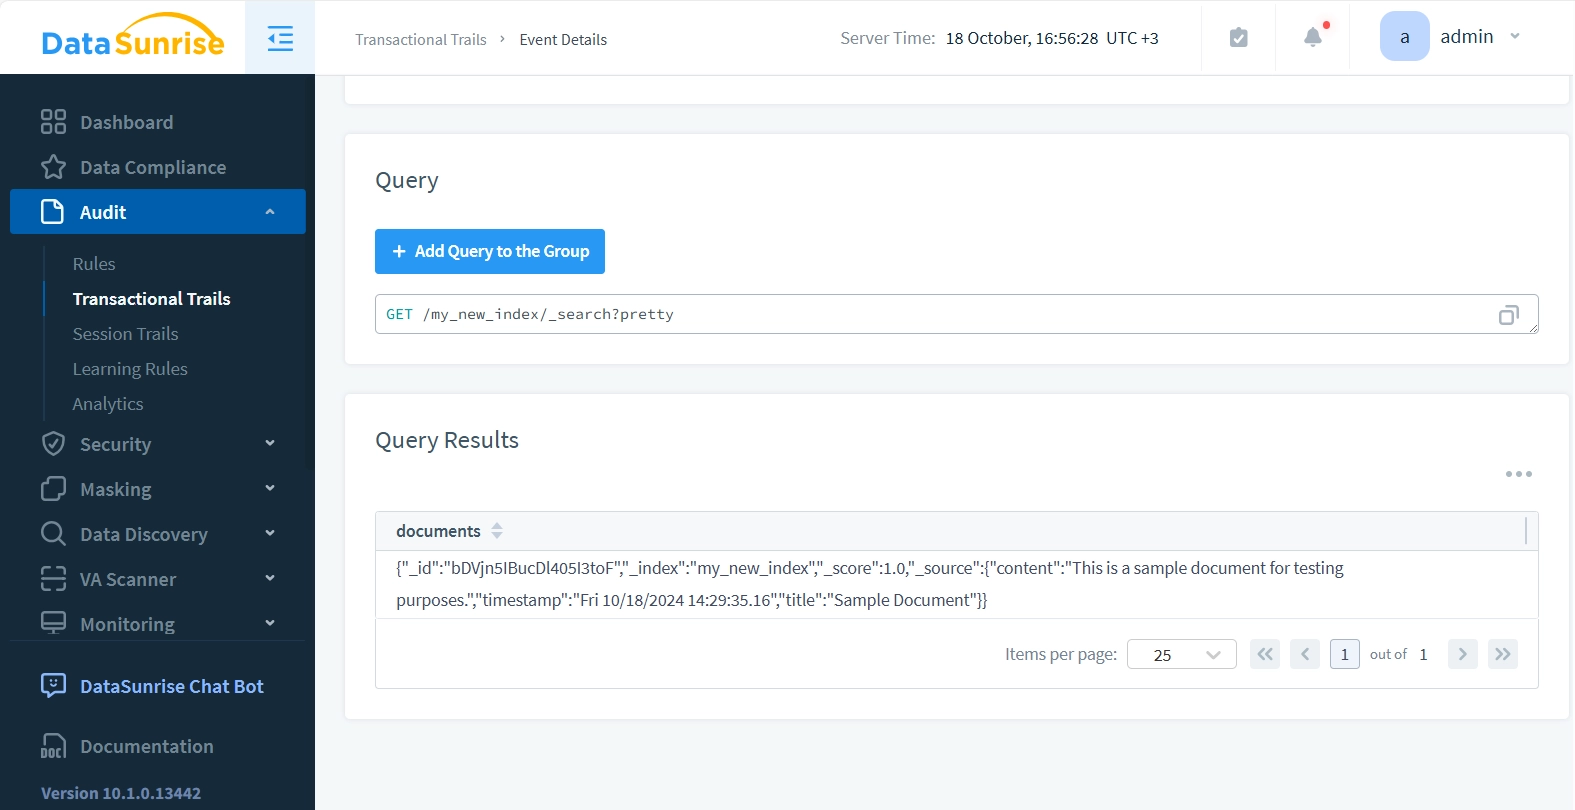
In Event Details, the Event number is clickable and displays the query results (we enabled this before).
Conclusion
Elasticsearch data audit trail is a valuable tool for enhancing search security and maintaining data integrity. By enabling the trial feature and following the steps outlined in this guide, you can significantly improve your data security posture.
However, for organizations requiring more advanced security measures, solutions like DataSunrise offer comprehensive protection across multiple databases. These tools provide the robust security features necessary in today’s complex data environments.
Remember, data security is an ongoing process. Regularly review and update your security measures to stay ahead of potential threats and ensure the safety of your valuable data.
Note on DataSunrise: DataSunrise offers cutting-edge, AI-based tools for database security. Our flexible solutions cater to diverse organizational needs, providing comprehensive protection for your valuable data assets. We invite you to visit the DataSunrise website to schedule an online demo and experience firsthand how our advanced security features can fortify your data infrastructure.
