Elasticsearch Database Activity History

The Growing Importance of Data Audit in Modern Infrastructure
As data science tools and libraries become more user-friendly, data-driven insights become more accessible. Elasticsearch, a powerful search and analytics engine, processes millions of records daily. Therefore, maintaining an Elasticsearch database activity history of important server activities is essential for modern organizations.
Elasticsearch takes security seriously through multiple initiatives. They maintain an active bug bounty program on HackerOne, where security researchers can report vulnerabilities and receive compensation for their findings. The company regularly publishes security announcements and updates through their official security advisory portal, ensuring users stay informed about potential risks and fixes.
Did you know? Organizations face an average cost of $4.88 million per data breach in 2024. This makes proper audit trailing not just a security measure, but a financial necessity.
Basic Concepts of Elasticsearch Database Activity History
Elasticsearch offers built-in audit capabilities through its security features. These features track user actions, system changes, and data access patterns. The audit system monitors user authentication attempts and records all significant events within the database environment. Through careful tracking of index operations and document modifications, organizations can maintain a comprehensive database activity history. The system also logs search queries and configuration changes, providing a complete picture of database usage.
Getting Started with Elasticsearch Audit Trail
The audit capability in Elasticsearch comes as a trial feature. To explore these functions, you’ll need to activate the 30-day trial period (you can extend this period). During this time, you can test audit logging and user activity monitoring capabilities. This trial period helps organizations understand the basic security requirements of their Elasticsearch deployment.
I enabled audit and run the query like this (bat file for convinience):
@echo off
set "ELASTICSEARCH_URL=https://localhost:9200"
set "AUTH_CREDS=elastic:CsJZ*aYV-aUzw_8aH2Pm"
set "DOC={\"title\": \"My first document\", \"content\": \"This is some test content\", \"timestamp\": \"2024-10-22\"}"
curl --ca-native --ssl-no-revoke -X POST "%ELASTICSEARCH_URL%/test-index/_doc" ^
    -H "Content-Type: application/json" ^
    -u "%AUTH_CREDS%" ^
    -d "%DOC%"
pause
I got this audit output (6 events truncated):
{"type":"audit", "timestamp":"2024-10-22T19:22:23,034+0300", "cluster.uuid":"ScaTr0vuRoi1-jCkuiyk2A", "node.name":"DESKTOP-KO7CURP", "node.id":"DUwRyLqiRXWTW-RbD8JTcA", "host.ip":"127.0.0.1", "event.type":"ip_filter", "event.action":"connection_granted", "origin.type":"rest", "origin.address":"[::1]:63018", "transport.profile":".http", "rule":"allow default:accept_all"}
…
{"type":"audit", "timestamp":"2024-10-22T19:22:23,157+0300", "cluster.uuid":"ScaTr0vuRoi1-jCkuiyk2A", "node.name":"DESKTOP-KO7CURP", "node.id":"DUwRyLqiRXWTW-RbD8JTcA", "host.ip":"127.0.0.1", "event.type":"transport", "event.action":"access_granted", "authentication.type":"REALM", "user.name":"elastic", "user.realm":"reserved", "user.roles":["superuser"], "origin.type":"rest", "origin.address":"[::1]:63018", "request.id":"PRcjusZXQYGC1ff-sWTjeA", "action":"indices:admin/mapping/auto_put", "request.name":"PutMappingRequest"}
When you make a single document insertion request to Elasticsearch, it triggers multiple internal operations because Elasticsearch performs several steps to ensure proper data handling, security, and consistency. Here’s why you see 8 events:
- Connection check (ip_filter) – Basic network security
- User authentication (rest) – Verifying your credentials
- Index write permission – Checking if you can write to the index
- Bulk write operations (4 events) – Elasticsearch internally uses bulk operations even for single document insertions:
- Initial bulk write permission
- Bulk shard request
- Bulk item creation
- Bulk shard processing
- Mapping update – Automatic schema update for new document structure
This is normal behavior because:
- Security checks happen at multiple levels (network, auth, permissions)
- Writing data involves both the primary shard and replica shards
- Document insertion may require schema/mapping updates
- Elasticsearch optimizes single-document operations by using its bulk operation infrastructure
So while you made one API call, Elasticsearch performs multiple internal operations, and with audit logging set to “_all”, you see all these internal steps in the audit trail.
Limitations of Elasticsearch Database Activity History
While Elasticsearch database activity history provides basic security coverage, they come with notable constraints.
- The monitoring capabilities focus on basic events without deep customization options.
- From a data auditing perspective, the most relevant event for tracking who accessed/modified data would be only one. The other 7 events are more about internal Elasticsearch technical operations rather than meaningful audit trail of data access/modifications. If you want to focus purely on data auditing, you might want to modify the audit settings to only include specific events instead of “_all”.
- The reporting tools, while functional, may not meet complex compliance requirements.
- Organizations often need more comprehensive solutions for enterprise-level security and compliance needs.
Enhanced Audit Solutions: DataSunrise Database Security
DataSunrise offers a comprehensive approach to database security and audit. The platform operates in five distinct modes, each balancing feature availability with performance impact. This flexibility allows organizations to choose the perfect setup for their needs. The solution integrates seamlessly with existing infrastructure, minimizing disruption to ongoing operations.
Advanced Features and Performance
DataSunrise’s user-friendly web interface makes security management straightforward and efficient. The platform includes an innovative LLM-based security assistant, trained on extensive documentation and real support cases. This AI-powered tool provides intelligent suggestions and automated responses to security challenges. The multi-database support enables centralized security management across various database types.

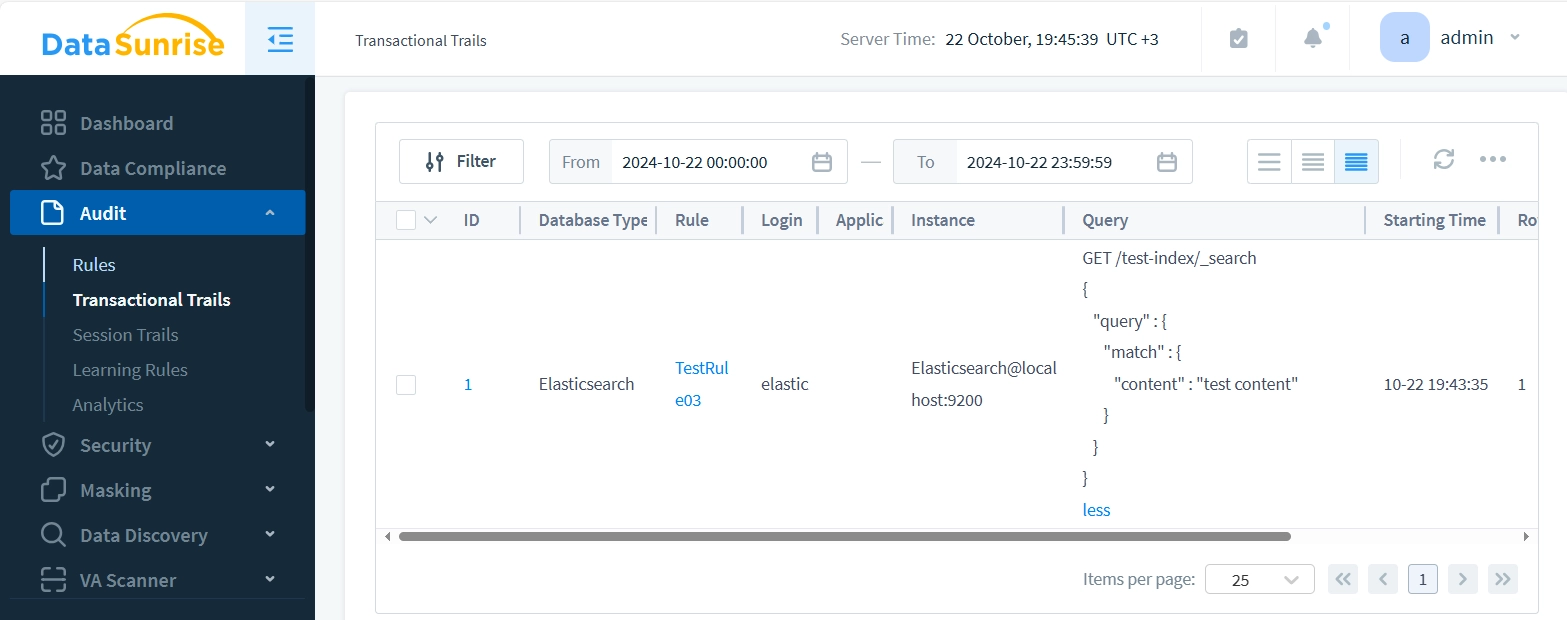
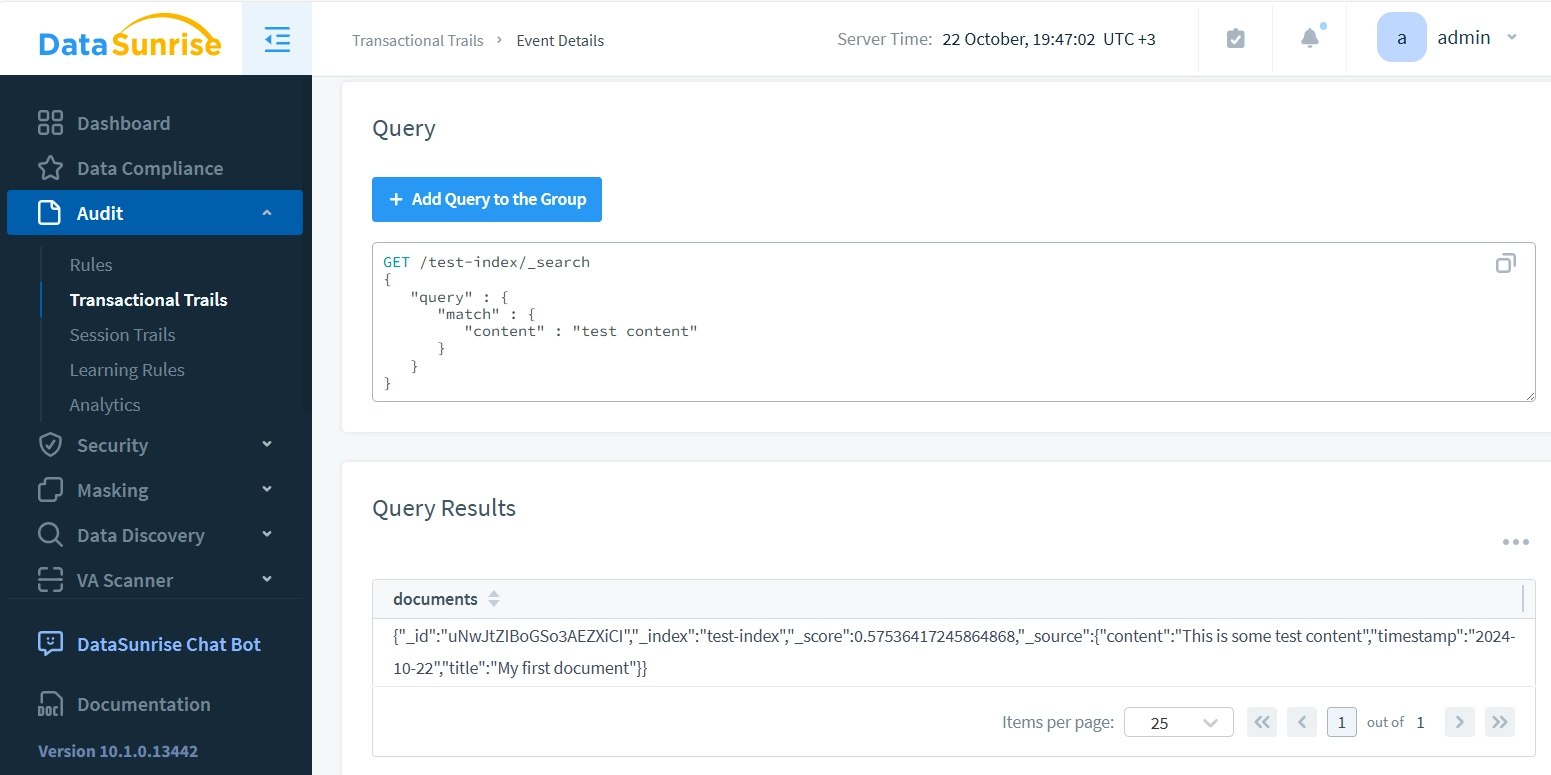
The rule with query results logged looks as follows:

Query sent through DataSunrise proxy (port 9201):
@echo off
set "ELASTICSEARCH_URL=https://localhost:9201"
set "AUTH_CREDS=elastic:CsJZ*aYV-aUzw_8aH2Pm"
set "QUERY={\"query\":{\"match\":{\"content\":\"test content\"}}}"
curl --ca-native -k -X GET "%ELASTICSEARCH_URL%/test-index/_search" ^
     -H "Content-Type: application/json" ^
     -u "%AUTH_CREDS%" ^
     -d "%QUERY%"
pause
The audit trail for this transaction shows:

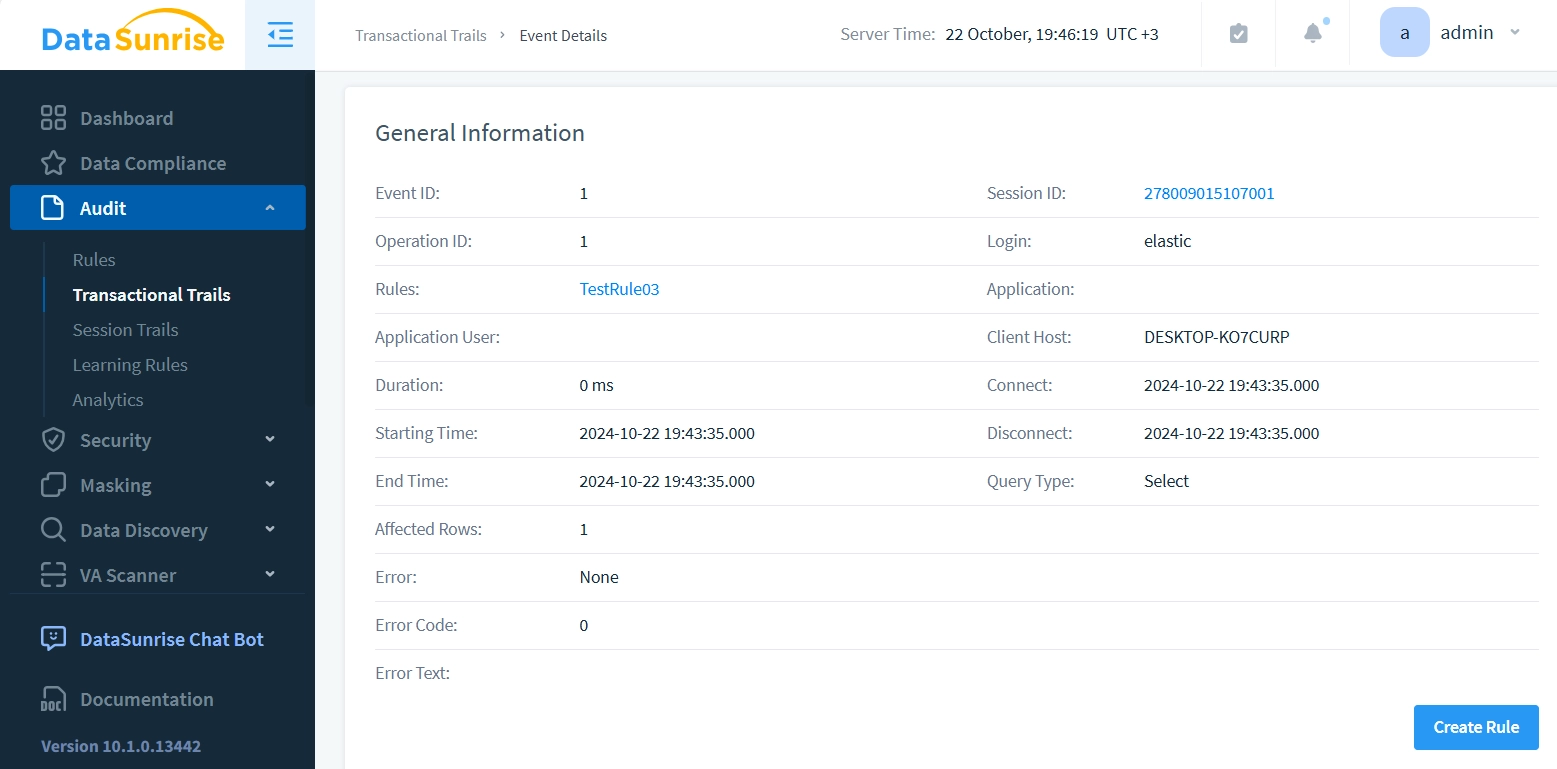
Clicking the ID reveals detailed information:


Best Practices for Implementation
Successful audit trail implementation requires careful planning and execution. Organizations should start by defining clear audit policies aligned with compliance requirements. Regular monitoring and review of audit logs helps identify potential security issues early. Setting up appropriate alert thresholds ensures quick response to suspicious activities. Maintaining proper documentation helps track security measures and demonstrate compliance.
Summary and Conclusions
Effective database activity monitoring stands crucial for modern organizations. While Elasticsearch offers basic audit capabilities through its trial program, comprehensive solutions like DataSunrise provide enhanced security features and better control. The choice between these options depends on organizational needs, compliance requirements, and security goals.
DataSunrise leads the industry with cutting-edge AI-based database security tools. Our platform offers flexible deployment options, comprehensive audit capabilities, and advanced security features. Experience the power of intelligent database security – visit DataSunrise.com for an online demo and see how we can strengthen your data protection strategy.
