
Impala Database Activity History

Introduction
In today’s world, businesses work with huge amounts of sensitive information through their Hadoop systems. A study by Oracle found that 72% of business leaders struggle to make important decisions because they don’t trust their data or because there’s just too much of it. This shows how important it is to have good data management and security.
In this environment, Apache Impala plays a key role by helping businesses analyze large amounts of data in real-time. With so much data being processed, keeping track of what happens in the database is more important than ever. This is because data breaches have affected over 18 billion accounts by the year 2024, making security even more crucial. For businesses, database activity history has transformed from a simple logging tool into a critical part of ensuring security.
Native Features for Tracking Impala Database Activity History
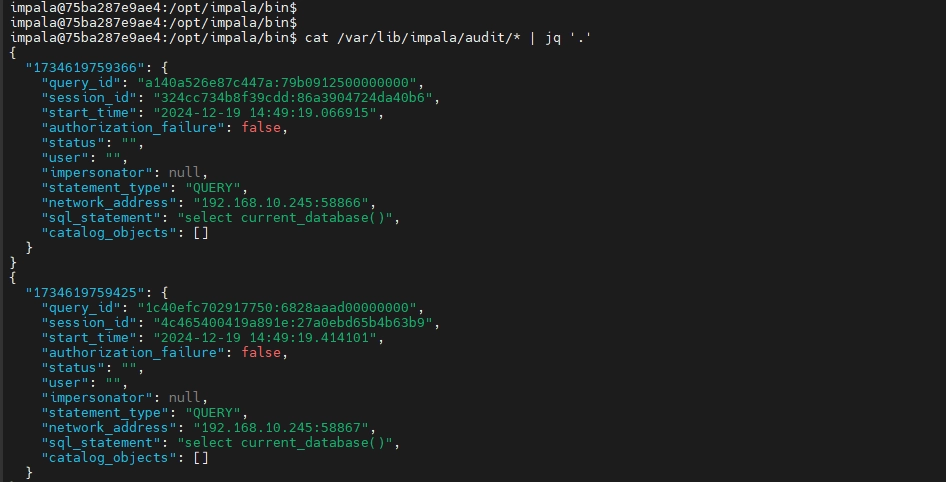
By default Impala comes with pre-installed capabilities for tracking database activity through its audit logging system. To enable these features, administrators need to configure the Impala Daemon by setting the audit log directory.
`# Impala Daemon audit logging start-up flag
--audit_event_log_dir=/var/lib/impala/audit`
After configuration, the system begins capturing detailed information about database operations, including query execution, user sessions, and access patterns. The audit logs provide an audit trail for each action performed on Impala database. Each log entry contains important details such as query IDs, session information, timestamps, and SQL statements executed. This level of detail helps administrators understand database usage patterns and investigate potential security concerns.
Real-Time Monitoring Capabilities
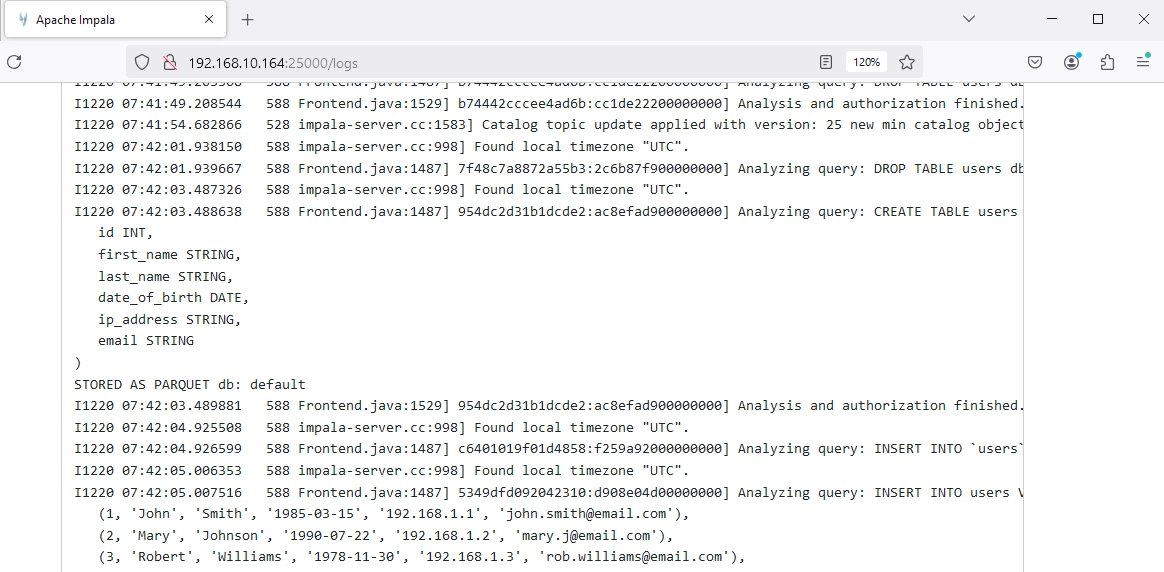
Impala's Web UI serves as a central point for monitoring database activity in real-time. Accessible through the default port 25000, this interface provides administrators with immediate visibility into ongoing database operations. The system tracks active queries, resource utilization, and historical query patterns, enabling quick identification of performance issues or unusual activity.
Beyond Native Tools
While Impala's built-in monitoring capabilities provide essential functionality, enterprise environments often demand more sophisticated solutions. DataSunrise addresses these needs through its comprehensive database audit, compliance and security platform. The solution offers a centralized feature-packed management console which allows teams to monitor multiple database instances from a single dashboard, significantly reducing administrative overhead.
Advanced Impala Database Activity History Controls with DataSunrise
DataSunrise provides an unprecedented level of control over Impala database activity history through its intuitive interface and robust auditing capabilities. Let's explore a practical example to demonstrate these features in action.
Setting Up the Environment
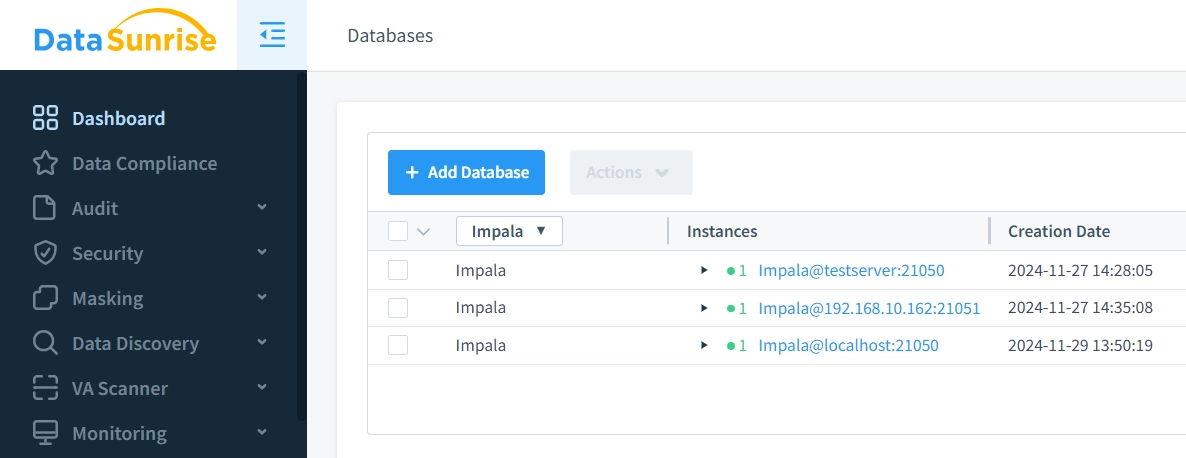
After connecting your Impala instances and configuring basic audit rules, you can begin monitoring access patterns and user activities in real-time.
Practical Demonstration
To demonstrate, we will use the impyla library to interact with the Impala database. Install the library with the following command:
pip install impyla
Here is a Python script aimed to perform several various database operations that DataSunrise will track:
from impala.dbapi import connect

def test_audit_events():
    conn = connect(host='localhost', port=21050)
    cursor = conn.cursor()

    try:
        # Test database and table operations
        cursor.execute("DROP DATABASE IF EXISTS test_audit CASCADE")
        cursor.execute("CREATE DATABASE test_audit")
        cursor.execute("USE test_audit")
        cursor.execute("CREATE TABLE audit_test (id INT) STORED AS PARQUET")

        # Test queries and errors
        cursor.execute("SELECT * FROM audit_test")
        cursor.execute("SELECT * FROM nonexistent_table")  # Will generate error

        # Cleanup
        cursor.execute("DROP DATABASE test_audit CASCADE")
    except Exception as e:
        print(f"Error: {e}")
    finally:
        conn.close()

if __name__ == "__main__":
    test_audit_events()
Advanced Impala Database Activity History Features
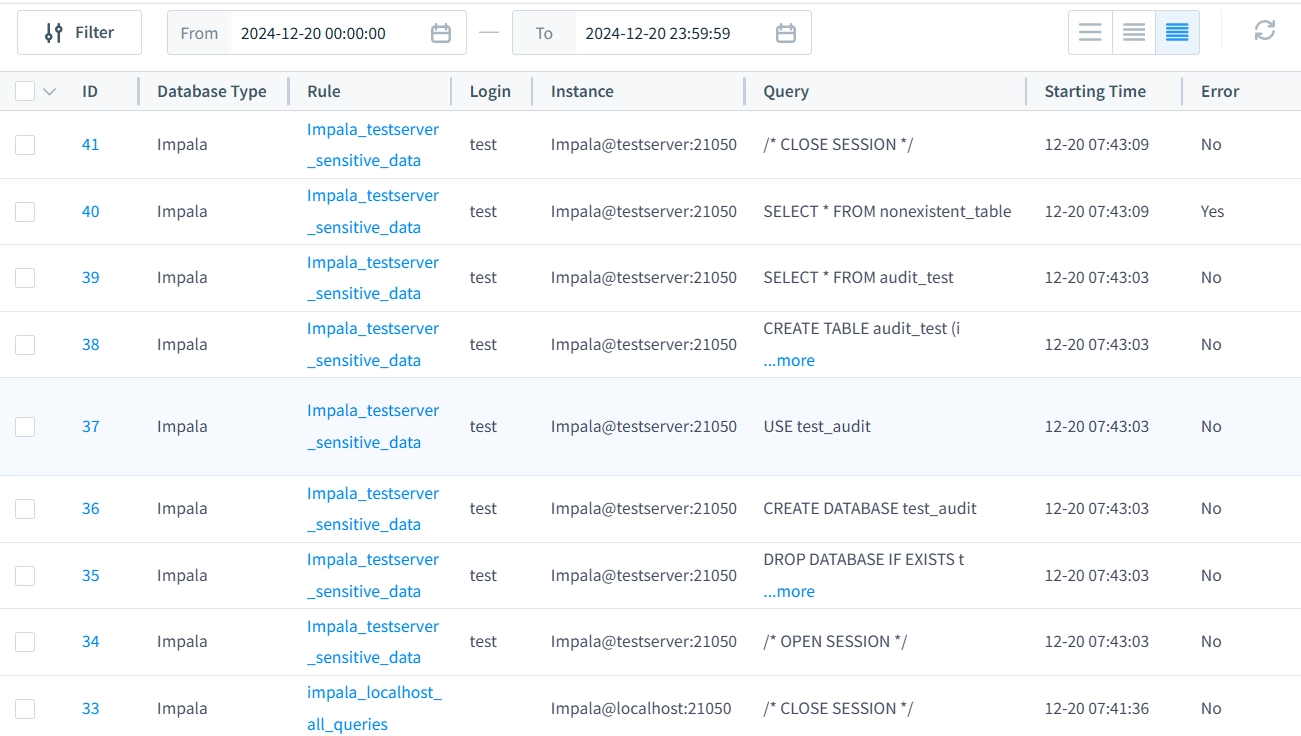
As you can see in the screenshot below, upon the script execution, DataSunrise captured all database actions which it performed. The system provides comprehensive visibility into who accesses the database, how they interact with it, and when these interactions occur.
And here’s the crazy magic killer-feature part:
DataSunrise's interface facilitates context-aware rule creation directly from the audit log. For example, you can select a specific query from the log and seamlessly create rules or add queries and database objects to specific groups. In this demonstration, we'll focus on the "Create Rule" option to showcase this capability.
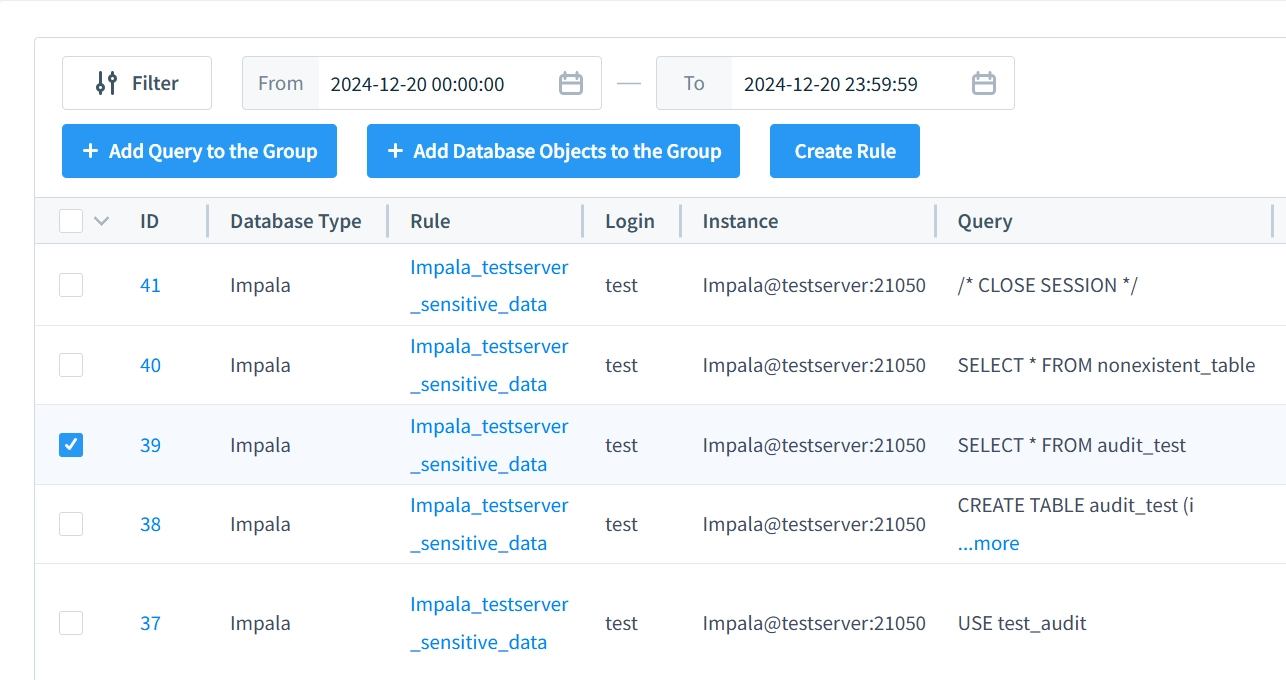
The context-aware options enable the creation of detailed audit, security, or masking rules tailored to the selected action. For this example, let's block access for the user and IP address from which a particular query originated.

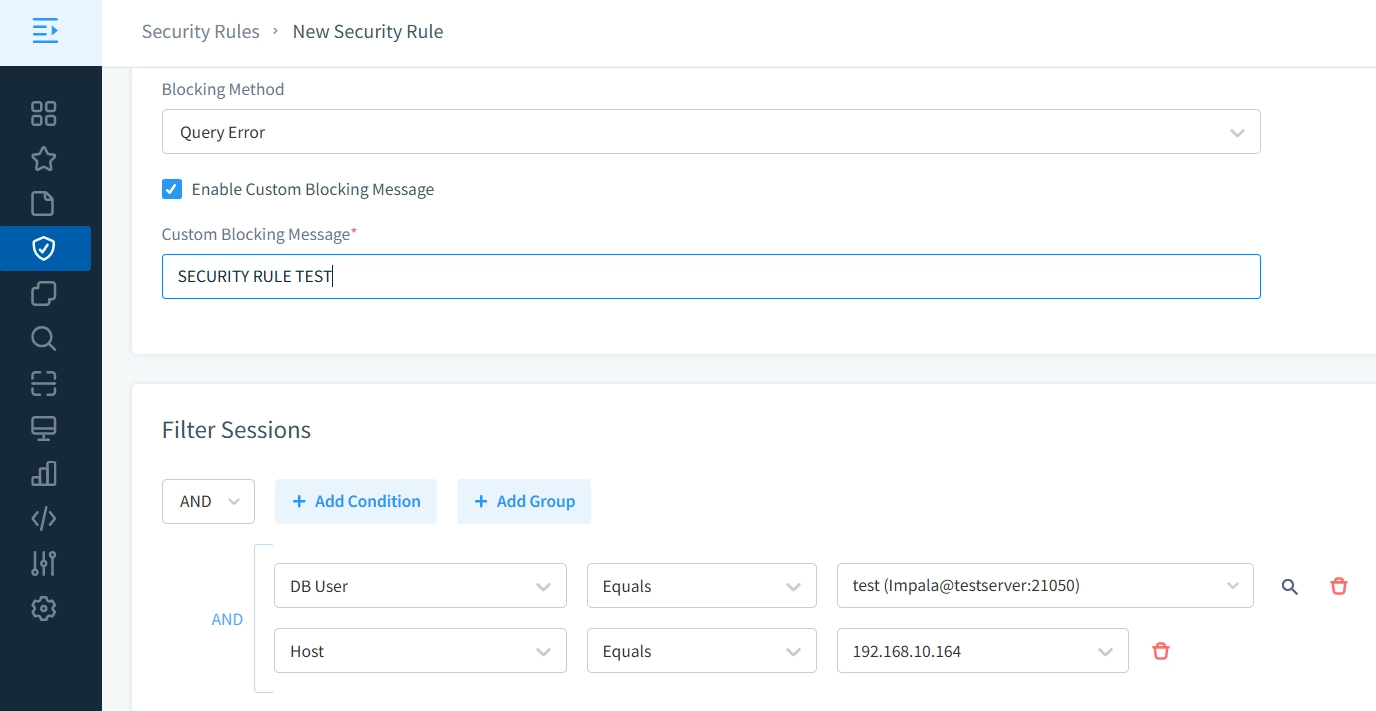
By pressing the "Create" button, you're directed to the New Security Rule section. Here, the filters are preconfigured based on the query details previously selected. For demonstration purposes, we’ll enable a custom blocking message: "SECURITY RULE TEST".
Next, we execute the query again. As expected, the blocking message appears, indicating that the security rule successfully intercepted and blocked the query.

Once triggered, you can view the security rule’s details in the Security Events section, including records and specifics about the action.

DataSunrise: Secure and Compliant Impala Database Activity History
DataSunrise revolutionizes database activity monitoring with its innovative dynamic data masking technology. This feature protects sensitive data by ensuring only authorized users can access it, all while maintaining a seamless user experience. Complementing this is its powerful real-time notification system, which instantly alerts security teams to potential violations or suspicious activities, enabling rapid and effective responses.
Designed to simplify compliance management, DataSunrise supports all major regulatory frameworks, including SOX, GDPR, HIPAA, and PCI DSS. With automated compliance reporting, organizations can effortlessly create detailed audit trails and compliance documentation, saving time and resources. Additionally, the platform leverages cutting-edge LLM and ML tools to improve threat detection and automate security measures for enhanced protection.
Seamless Impala Integration
DataSunrise offers versatile deployment options tailored to fit diverse infrastructure needs. It integrates seamlessly with existing database environments, delivering enterprise-grade security features without compromising performance. The platform’s scalable architecture ensures reliability even as data volumes grow, while its intuitive interface minimizes the learning curve for security teams.
With continuous monitoring and automated updates, DataSunrise maintains robust security coverage while ensuring operational efficiency. Its flexible implementation ensures organizations can enhance database security and compliance without disrupting day-to-day operations.
Conclusion
While Impala's native database activity tracking provides essential monitoring capabilities, modern environments require more comprehensive solutions. DataSunrise offers advanced tools that scale with organizational needs while maintaining robust security coverage and ensuring operational efficiency. Its flexible and fast-to-implement deployment enables organizations to strengthen database security and compliance seamlessly without disrupting day-to-day operations.
Ready to enhance your Impala database monitoring? Try DataSunrise's demo to experience advanced activity tracking capabilities firsthand.
