Junk Data

In today’s data-driven world, the quality of information plays a crucial role in decision-making processes. However, organizations often grapple with the challenge of junk data because not all data is good enough. This article examines such data processing, how it impacts data sets. We also offer solutions to maintain data accuracy.
What is Junk Data?
Junk data refers to information that is inaccurate, incomplete, irrelevant, or corrupted within a dataset. It can also contain human errors. This data takes various forms, such as:
- Duplicate entries
- Outdated information
- Formatting errors
- Incomplete records
- Irrelevant data points
This data can make analyzing data less effective and result in incorrect insights if not fixed.
The Impact of Junk Data on Data Analyzing
Junk data can have far-reaching consequences on the data analyzing process. Here are some keyways it affects the integrity and usefulness of your data:
1. Skewed Results
When misleading data is present in a dataset, it can lead to inaccurate statistical calculations and misrepresented trends. This skewing of results can cause organizations to make poor decisions based on faulty information.
2. Reduced Efficiency
Processing and analyzing data consumes valuable time and resources. Data analysts may spend hours cleaning and sorting through irrelevant information, reducing overall productivity.
3. Increased Costs
The presence of duplicate data often necessitates additional storage space and processing power. This can lead to increased infrastructure costs for organizations dealing with large volumes of data.
4. Loss of Credibility
Insights derived from wrong data can erode trust in an organization’s decision-making processes. This loss of credibility can have long-lasting effects on both internal operations and external relationships.
Data Classification Approaches Using Open-Source Tools
To effectively manage junk data, organizations can implement various data classification approaches. Here are some open-source tools that can aid in this process:
1. Apache NiFi
Apache NiFi is a powerful data integration and processing tool that can help classify and route data based on predefined rules. It offers a user-friendly interface for creating data flows and applying filters to identify and segregate junk data.
Example:
Apache NiFi Data Classification Flow
- Create a new process group
- Add a GetFile processor to ingest data
- Connect to a RouteOnAttribute processor
- Define rules to classify data (e.g., ${filename:contains(‘junk’)})
- Route classified data to appropriate destinations
Result: This setup will automatically classify incoming files based on their attributes and route them accordingly. It helps to isolate potential bad data for further processing or removal.
2. OpenRefine
OpenRefine (formerly Google Refine) is a versatile tool for cleaning and transforming messy data. It provides features for detecting and removing duplicate entries, standardizing formats, and clustering similar data points.
Example:
OpenRefine Duplicate Detection
- Load your dataset into OpenRefine
- Select the column containing potential duplicates
- Choose “Facet” > “Customized facets” > “Duplicates facet”
- Review and merge or remove duplicate entries
Result: This process will identify duplicate records in your dataset, allowing you to clean up redundant information.
3. Talend Open Studio
Talend Open Studio (retired) is an open-source data integration platform that includes powerful data quality and profiling tools. It can help identify patterns, and anomalies in your data.
Example:
Talend Data Quality Analysis
- Create a new job in Talend Open Studio
- Drag and drop a tFileInputDelimited component to read your data
- Connect it to a tDataProfiler component
- Configure the profiler to analyze specific columns
- Run the job and review the data quality report
Result: This job will generate a comprehensive report on your data’s quality, highlighting potential junk data issues such as missing values, outliers, and format inconsistencies.
Avoiding Sensitive Data Removal or Misuse
While processing bad data, it’s crucial to ensure that sensitive information is not inadvertently removed or misused. Here are some best practices to follow:
1. Implement Data Masking
Use data masking techniques to obscure sensitive information while preserving the overall structure of the data. This allows for analysis without exposing confidential details.
2. Establish Access Controls
Implement strict access controls to ensure that only authorized personnel can view and manipulate sensitive data during the junk data processing phase.
3. Maintain Audit Trails
Keep detailed logs of all data processing activities, including who accessed the data, what changes were made, and when. This helps in tracking any potential misuse or accidental removal of important information.
4. Use Data Classification Tags
Apply classification tags to your data, clearly marking sensitive information. This helps in identifying which data requires special handling during the junk data removal process.
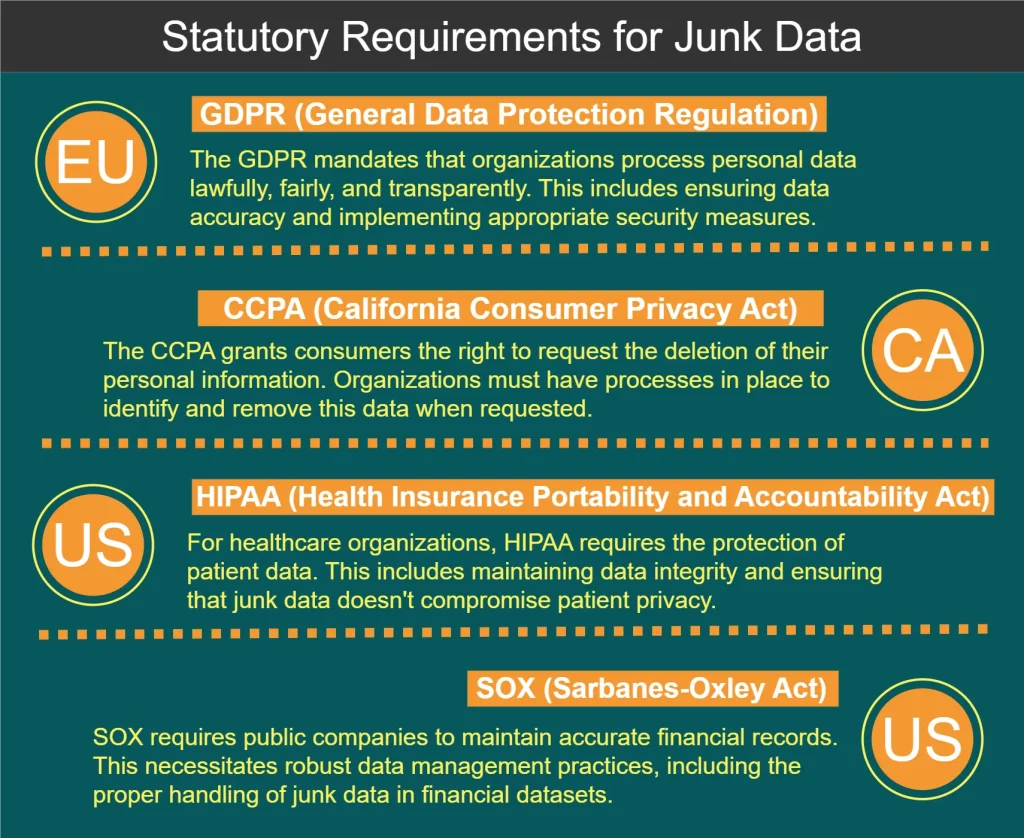
Statutory Requirements for Junk Data Processing
Several regulations and standards govern the handling of data, including junk data processing. Some key requirements are shown at the diagram below:
Best Practices for Junk Data Processing
To effectively manage data and maintain data integrity, consider the following best practices:
- Implement data validation at the point of entry to prevent junk data from entering your systems.
- Regularly audit your datasets to identify and address data quality issues.
- Develop a comprehensive data governance policy that includes guidelines for handling junk data.
- Invest in employee training to ensure that all team members understand the importance of data quality.
- Use automated tools to streamline the junk data identification and removal process.
- Implement a data quality scoring system to track improvements over time.
- Establish a feedback loop with data users to quickly identify and address data quality issues.
In the end on this article, we also mention how to implement simple junk data detection methods in python.
Analyzing Data and Identifying Junk Data Using Python
Python has become a go-to language for data analysis due to its simplicity, versatility, and robust ecosystem of data-centric libraries. Here are some ways to analyze data and identify junk data using Python:
1. Pandas for Data Manipulation and Analysis
Pandas is a powerful library for data manipulation and analysis in Python. It provides data structures like DataFrames that make it easy to work with structured data.
Example: Identifying missing values and duplicates
import pandas as pd
# Load data into a DataFrame
df = pd.read_csv('your_data.csv')
# Check for missing values
missing_values = df.isnull().sum()
# Identify duplicate rows
duplicates = df.duplicated().sum()
print("Missing values:\n", missing_values)
print("Number of duplicate rows:", duplicates)
Result: This script will output the count of missing values for each column and the total number of duplicate rows in your dataset, helping you identify potential junk data.
2. Matplotlib and Seaborn for Data Visualization
Visualizing your data can help identify outliers and unusual patterns that might indicate junk data.
Example: Creating a box plot to spot outliers
import pandas as pd
import matplotlib.pyplot as plt
import seaborn as sns
# Load data
df = pd.read_csv('your_data.csv')
# Create a box plot
plt.figure(figsize=(10, 6))
sns.boxplot(x='category', y='value', data=df)
plt.title('Distribution of Values by Category')
plt.show()
Result: This will generate a box plot that visually represents the distribution of values across different categories, making it easy to spot outliers that could be junk data.
3. Scikit-learn for Anomaly Detection
Scikit-learn offers machine learning algorithms that can be used for anomaly detection, helping identify unusual data points that might be junk.
Example: Using Isolation Forest for anomaly detection
import pandas as pd
from sklearn.ensemble import IsolationForest
# Load and prepare data
df = pd.read_csv('your_data.csv')
X = df[['feature1', 'feature2']] # Select relevant features
# Create and fit the model
iso_forest = IsolationForest(contamination=0.1, random_state=42)
outliers = iso_forest.fit_predict(X)
# Add results to the DataFrame
df['is_outlier'] = outliers
# View potential junk data (outliers)
junk_data = df[df['is_outlier'] == -1]
print(junk_data)
Result: This script will use the Isolation Forest algorithm to identify potential outliers in your dataset, which could indicate junk data.
4. Custom Functions for Data Quality Checks
You can create custom Python functions to perform specific data quality checks tailored to your dataset.
Example: Checking for unrealistic values in a temperature dataset
import pandas as pd
def check_temperature_range(df, column, min_temp, max_temp):
  """Check if temperature values are within a realistic range."""
  outliers = df[(df[column] < min_temp) | (df[column] > max_temp)]
  return outliers
# Load data
df = pd.read_csv('temperature_data.csv')
# Check for unrealistic temperatures (e.g., below -100°C or above 60°C)
junk_temps = check_temperature_range(df, 'temperature', -100, 60)
print("Potentially junk temperature readings:")
print(junk_temps)
Result: This function will identify temperature readings that fall outside a specified realistic range, helping to spot potentially erroneous or junk data.
5. Profiling Data with ydata-profiling
The ydata-profiling library (formerly pandas-profiling) provides an easy way to generate comprehensive reports about your dataset, including potential quality issues.
Example: Generating a data profile report
import pandas as pd
from ydata_profiling import ProfileReport
# Load data
df = pd.read_csv('your_data.csv')
# Generate report
profile = ProfileReport(df, title="Data Profiling Report", explorative=True)
# Save report to file
profile.to_file("data_profile_report.html")
Result: This script will generate an HTML report with detailed statistics, visualizations, and potential quality issues in your dataset, providing a comprehensive overview that can help identify junk data.
By incorporating these Python-based techniques into your data analysis workflow, you can more effectively identify and address junk data issues, improving the overall quality and reliability of your datasets.
Conclusion: The Path to Better Data Integrity
Junk data processing is a critical aspect of maintaining data integrity and ensuring the reliability of your data analysis efforts. By using strong classification methods, free tools, and following rules, organizations can greatly improve their data quality.
Remember that data cleaning is an ongoing effort that requires constant vigilance and adaptation to evolving data landscapes. By prioritizing data quality and implementing effective misleading data processing strategies, organizations can unlock the true potential of their data and make more informed decisions.
For user-friendly and flexible tools designed to enhance data security and ensure compliance, consider exploring DataSunrise’s offerings. Visit our website at DataSunrise.com for an online demo and discover how we can help you maintain data integrity while meeting regulatory requirements.