PostgreSQL Data Activity History: Best Practices for Monitoring and Security

PostgreSQL, a widely-used open-source relational database, offers several tools and approaches to monitor and track data activity history. This article will explore the basics of PostgreSQL data activity history, covering key methods such as pgaudit, cumulative statistics, and pg_stat_statements.
We will also guide you through setting up SQL query auditing for a sample table and introduce DataSunrise, a robust security suite that centralizes and simplifies data activity monitoring.
Why Monitoring Data Activity History Matters
Monitoring data activity history is essential for several reasons. It ensures that you can detect suspicious activity, meet compliance requirements, and optimize database performance. By keeping a close eye on who accessed your data, when, and what changes were made, you can safeguard your database against unauthorized access and potential data breaches. Furthermore, tracking data activity helps identify performance bottlenecks and optimize query execution, leading to a more efficient and secure database environment.
Approaches to Track Data Activity History in PostgreSQL
PostgreSQL provides various built-in tools and extensions to track and monitor data activity. Three of the most commonly used methods are pgaudit, cumulative statistics, and pg_stat_statements. Each of these tools offers unique functionalities, and understanding their differences will help you choose the right approach for your needs.
pgaudit: Comprehensive SQL Auditing
pgaudit is a PostgreSQL extension designed to provide detailed auditing of SQL statements. It logs all SQL activities, including DML (Data Manipulation Language) and DDL (Data Definition Language) statements. This tool is particularly useful for compliance purposes, as it allows administrators to keep a detailed record of database activities.
Setting Up pgaudit for Auditing SQL Queries
The following setup is for the Ubuntu 24.04 Server and PostgreSQL of version 16 installed from the Ubuntu repositories as shown below.
To set up pgaudit for auditing SQL queries on the mock_data table, follow these steps:
Install the pgaudit extension:
# sudo apt-get update
# sudo apt-get install postgresql-16-pgaudit
Set the extension in postgresql.conf:
nano /etc/postgresql/16/main/postgresql.conf
by editing the line: shared_preload_libraries = ‘pgaudit’.
And restart PostgreSQL Database daemon.
sudo systemctl restart postgresql
Enable the extension in the database using psql command lite interface:
CREATE EXTENSION pgaudit;
Configure the pgaudit settings (also in psql):
ALTER SYSTEM SET pgaudit.log = 'write';
Reload the PostgreSQL configuration:
SELECT pg_reload_conf();
Run SQL query on the mock_data table:
SELECT * FROM mock_data WHERE id = 1;
INSERT INTO mock_data (first_name, last_name, email, ip_address) VALUES ('John', 'Doe', 'johndoe@example.com', '192.168.1.1');
pgaudit will log these queries with their respective timestamps, allowing you to track who performed the actions and when. Use the following command to view end of the log file:
cat /var/log/postgresql/postgresql-16-main.log | tail -n 20
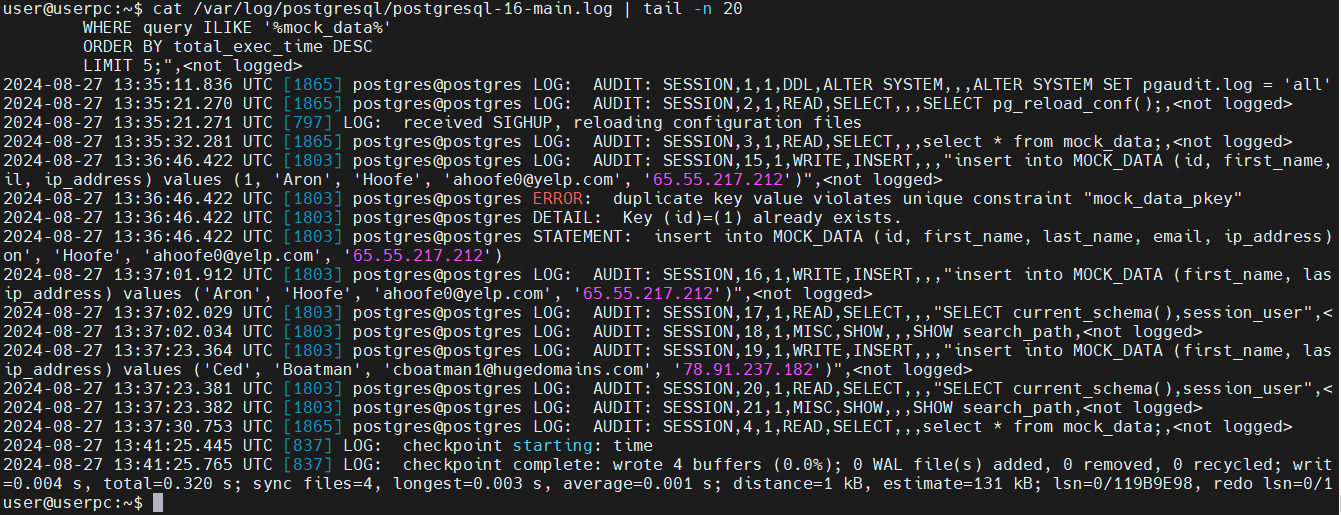
All lines labeled ‘AUDIT’ originate from the pgaudit extension.
Cumulative Statistics: Database-Wide Metrics
Cumulative statistics in PostgreSQL provide aggregated data about the database’s performance and usage. These statistics include information about the number of queries executed, tuples read, and blocks fetched, among other metrics. While cumulative statistics offer a broad overview of database activity, they lack the granularity of pgaudit, as they do not track individual SQL statements or their timestamps.
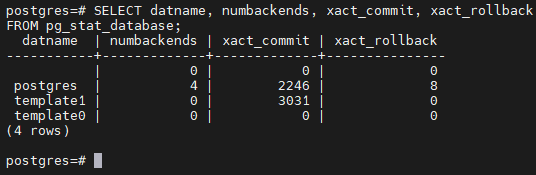
To access cumulative statistics, you can query the pg_stat_database view:
SELECT datname, numbackends, xact_commit, xact_rollback
FROM pg_stat_database;
To access the active running queries:
SELECT pid, usename, datname, state, query, query_start
FROM pg_stat_activity
WHERE state = 'active';
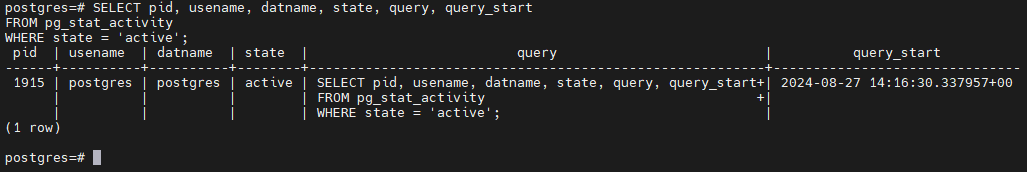
This view also provides valuable insights into database performance, but it does not offer the detailed auditing capabilities necessary for tracking specific data activities.
pg_stat_statements: Query Performance Monitoring
pg_stat_statements is another PostgreSQL extension that tracks the execution statistics of all SQL statements. Unlike cumulative statistics, pg_stat_statements focuses on query performance, providing details such as execution time, number of calls, and average time per call. This tool is particularly useful for identifying slow queries and optimizing database performance.
Installing and Using pg_stat_statements
Install the pg_stat_statements extension:
sudo apt-get update
sudo apt-get install postgresql-contrib
Configure the extension:
sudo nano /etc/postgresql/<version>/main/postgresql.conf
shared_preload_libraries = 'pg_stat_statements'
pg_stat_statements.track = all
pg_stat_statements.max = 1000
track_activity_query_size = 2048
Restart PostgreSQL:
sudo systemctl restart postgresql
Log in psql and create an extension:
CREATE EXTENSION pg_stat_statements;
Query the pg_stat_statements view:
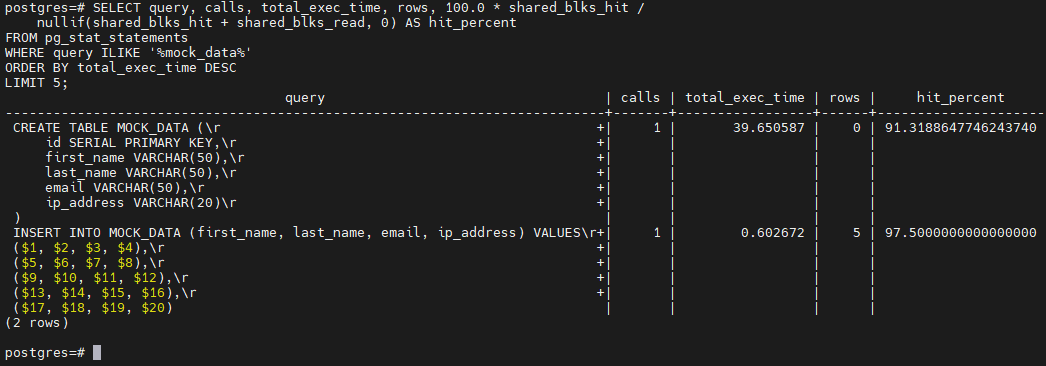
SELECT query, calls, total_exec_time, rows, 100.0 * shared_blks_hit /
    nullif(shared_blks_hit + shared_blks_read, 0) AS hit_percent
FROM pg_stat_statements
WHERE query ILIKE '%mock_data%'
ORDER BY total_exec_time DESC
LIMIT 5;
This will provide a list of the most time-consuming queries, helping you identify performance bottlenecks.
You can reset the statistics:
SELECT pg_stat_statements_reset();
Differences Between pgaudit, Cumulative Statistics, and pg_stat_statements
Each of these tools serves a different purpose in monitoring PostgreSQL data activity history:
pgaudit: Focuses on auditing and logging individual SQL statements for security and compliance purposes.
Cumulative Statistics: Provides aggregated performance metrics for the entire database, useful for a high-level overview.
pg_stat_statements: Tracks query execution performance, helping identify and optimize slow queries.
By combining these tools, you can achieve comprehensive monitoring and auditing of your PostgreSQL database, ensuring both security and performance.
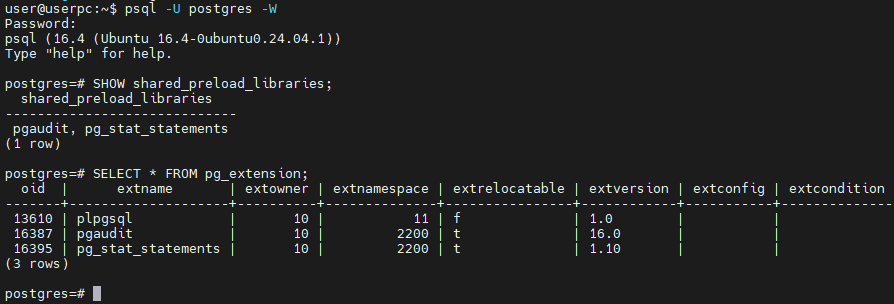
To check the if extensions are present in the database use the following commands:
SELECT * FROM pg_extension;
SHOW shared_preload_libraries;
The output may look as follows:
Leveraging DataSunrise for Centralized Data Activity Monitoring
While PostgreSQL’s built-in tools provide robust monitoring capabilities, managing data activity history across multiple databases can be challenging. This is where DataSunrise comes in. DataSunrise is a powerful security suite that offers centralized control over all data activity monitoring and auditing tasks.
Creating a DataSunrise Instance for PostgreSQL
Assuming DataSunrise is already installed, follow these steps to create an instance and monitor data activity history:
- Log in to the DataSunrise console.
- Navigate to the ‘Configuration – Databases’ section and create a new PostgreSQL instance.
- Configure the connection settings, including the database host, port, and credentials.
- Navigate to the Audit – Rules. Here create and specify the tables, columns and actions you wish to audit, such as SELECT, INSERT, UPDATE, and DELETE.
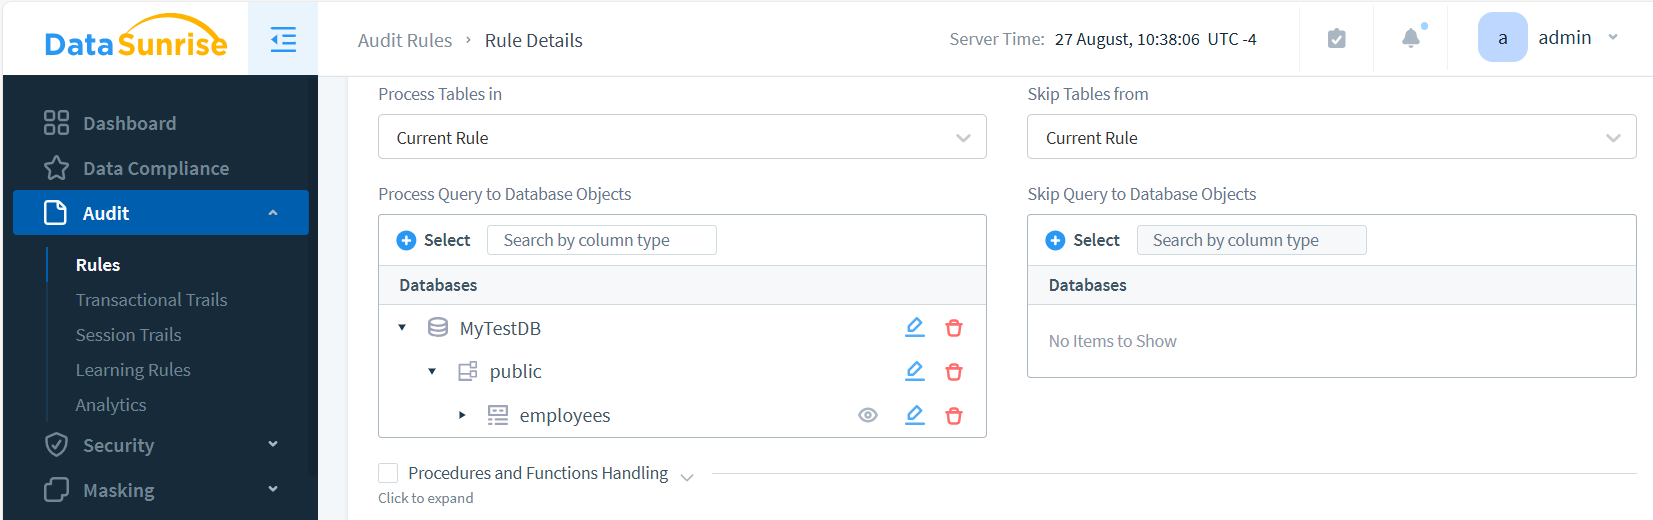
- Save the rule, and it will begin monitoring automatically. When you access the database through the instance’s proxy, DataSunrise intercepts the queries and logs all specified data to the Transactional Trails and Session Trails. You can view these logs in the ‘Audit – Transactional Trails’ and ‘Audit – Session Trails’ sections of the Audit interface.
DataSunrise will now capture and store all data activity history for the specified PostgreSQL instance, providing a centralized and uniform view of all actions performed on the database.
Benefits of Using DataSunrise
DataSunrise offers several advantages for managing PostgreSQL data activity history:
- Centralized Control: Manage and monitor all your databases from a single interface, reducing administrative overhead.
- Comprehensive Auditing: Track all SQL activities across multiple databases, ensuring compliance with regulatory requirements.
- Flexible Configuration: Customize auditing rules based on your specific needs, including filtering by user, action, or table.
- Real-Time Alerts: Receive notifications of suspicious activities, allowing you to take immediate action.
With DataSunrise, you gain a powerful tool for securing your PostgreSQL databases and ensuring that all data activity is tracked and recorded efficiently.
Conclusion
Monitoring data activity history in PostgreSQL is critical for maintaining security, compliance, and performance. Tools like pgaudit, cumulative statistics, and pg_stat_statements provide valuable insights into your database’s activities. For more advanced and centralized monitoring, DataSunrise offers a comprehensive solution that simplifies data activity tracking across multiple PostgreSQL instances. By combining these tools, you can achieve a secure and well-optimized database environment.
DataSunrise provides flexible, user-friendly tools for database security, including auditing, masking, and other advanced features. Visit our DataSunrise website to schedule an online demo and to explore how our solutions can help you manage your PostgreSQL data activity history more effectively.