TiDB Audit Trail
Introduction
When it comes to database management, setting up and maintaining a reliable audit trail for TiDB and other databases is essential for ensuring data security, optimizing performance, and meeting compliance requirements.
TiDB, a distributed SQL database designed for scalability, high availability, and strong consistency. provides native auditing tools that allow organizations to monitor data access and modifications effectively. However, these built-in solutions often come with their limitations. That’s why, in this article, we’ll examine how TiDB’s audit trails work and explore how DataSunrise can enhance your auditing practices with deeper insights and real-time monitoring capabilities.
Understanding TiDB Audit Trail
An audit trail system generates detailed logs of database operations using built-in mechanisms that track a wide range of events—from basic user authentication to complex data modifications. This chronological record is a valuable resource for database administrators, security professionals, and compliance officers.
Overview of Native TiDB Audit Trail
TiDB's native audit trail system provides a comprehensive solution for monitoring and recording database operations, offering organizations deep insights into their data ecosystem.
1. Slow Query Logging
Performance is the heartbeat of any database system. TiDB's slow query logging acts like a precise diagnostic tool, helping you pinpoint and address performance bottlenecks before they impact your application.
Key Features:
- Configurable threshold for slow query detection
- Detailed logging of time-consuming queries
- Customizable logging parameters
Example Configuration:
-- Set slow query threshold to 300ms
SET GLOBAL tidb_slow_log_threshold = 300;
-- Enable slow query logging
SET GLOBAL tidb_enable_slow_log = ON;
Documentation:
2. Statement Collection
Think of statement collection as your database's performance diary. It meticulously tracks and analyzes SQL statement execution, providing a granular view of your database's operational health.
Key Features:
- Tracks execution statistics for SQL statements
- Provides insights into query performance
- Supports detailed statement summaries
Example Queries:
-- Enable statement collection
SET GLOBAL tidb_enable_collect_execution_info = 1;
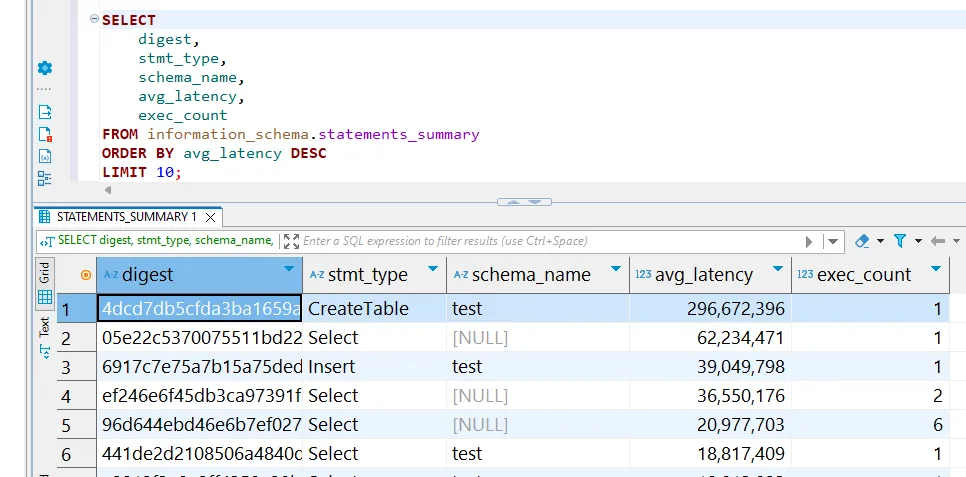
-- View top 10 slowest statements
SELECT
digest,
stmt_type,
schema_name,
avg_latency,
exec_count
FROM information_schema.statements_summary
ORDER BY avg_latency DESC
LIMIT 10;
Documentation:
3. Detailed Monitoring Views
Your database is a complex ecosystem, and understanding its intricate workings requires deep, multi-dimensional monitoring. TiDB's detailed views offer just that—a microscope into your database's performance and behavior.
Statement Analysis:
-- Track specific statement types
SELECT * FROM INFORMATION_SCHEMA.STATEMENTS_SUMMARY
WHERE digest_text LIKE 'INSERT%'
ORDER BY last_seen DESC
LIMIT 5;
Index Usage Monitoring:
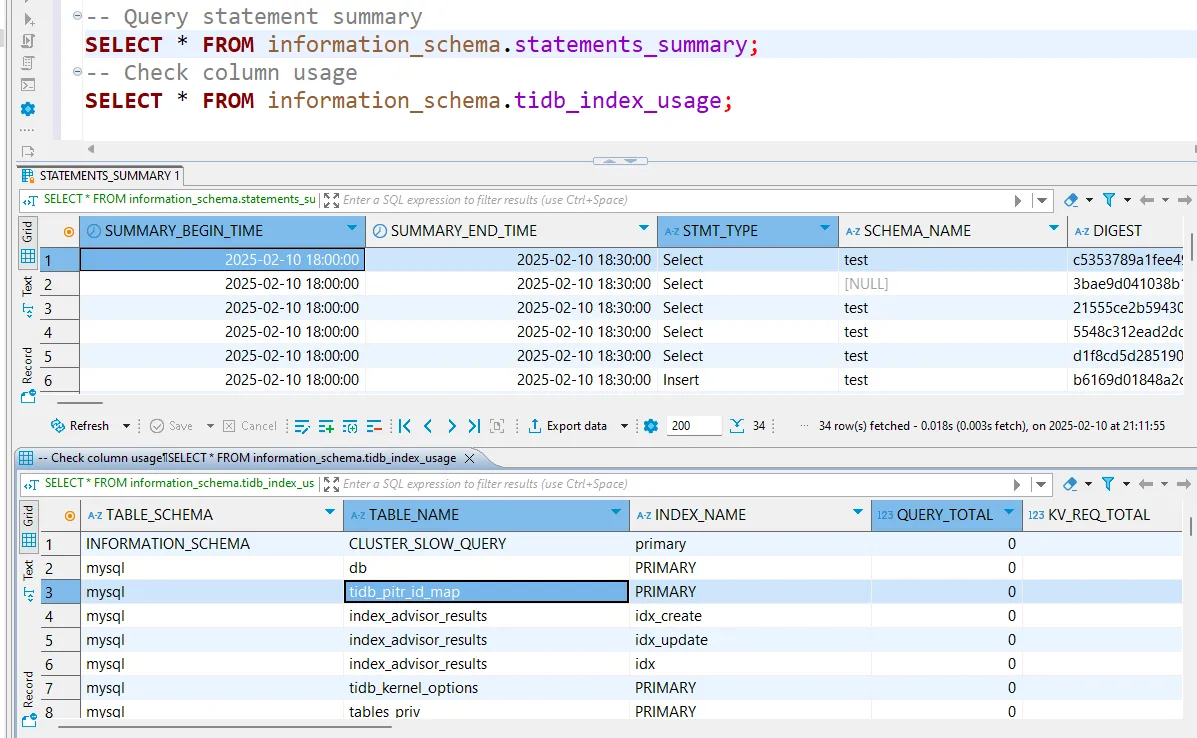
-- Comprehensive statement summaries
SELECT * FROM information_schema.statements_summary;
-- Monitor index usage patterns
SELECT * FROM information_schema.tidb_index_usage;
Documentation:
Each of these audit trail mechanisms works together to provide a holistic view of your database's performance, security, and operational efficiency. By leveraging these tools, you can proactively manage your database, optimize performance, and maintain a robust, secure data environment.
Integrating DataSunrise for Extensive TiDB Audit Trail
While TiDB provides basic audit trail capabilities, DataSunrise enhances the auditing process by offering a user-friendly interface and additional capabilities, such as centralized control over auditing rules, easy rule creation, and comprehensive audit trail visualizations.
Step 1: Connect to TiDB Database via DataSunrise
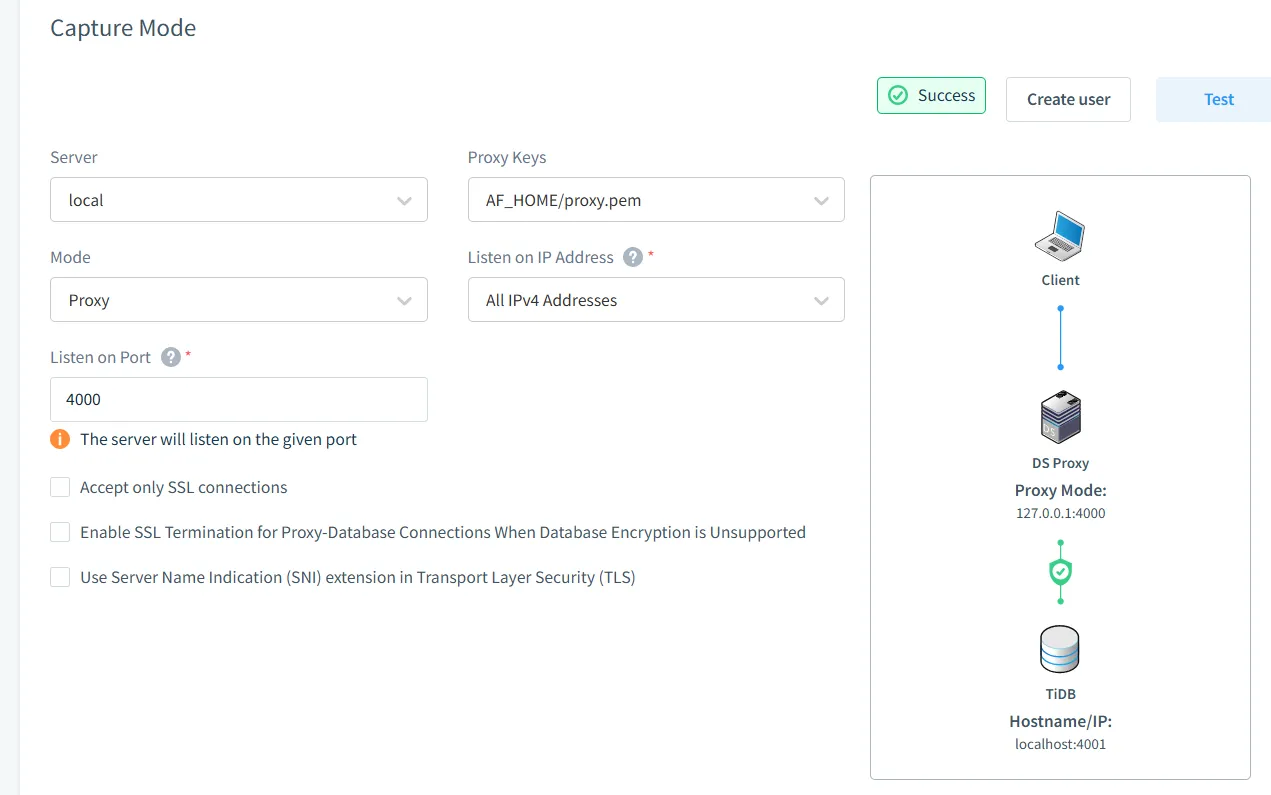
Once DataSunrise is installed, the first step is connecting it to your TiDB database instance. This is a straightforward process—simply provide the host, port, and login credentials of your TiDB server. Once connected, DataSunrise can begin monitoring database activity in real-time.
Step 2: Create an Audit Rule
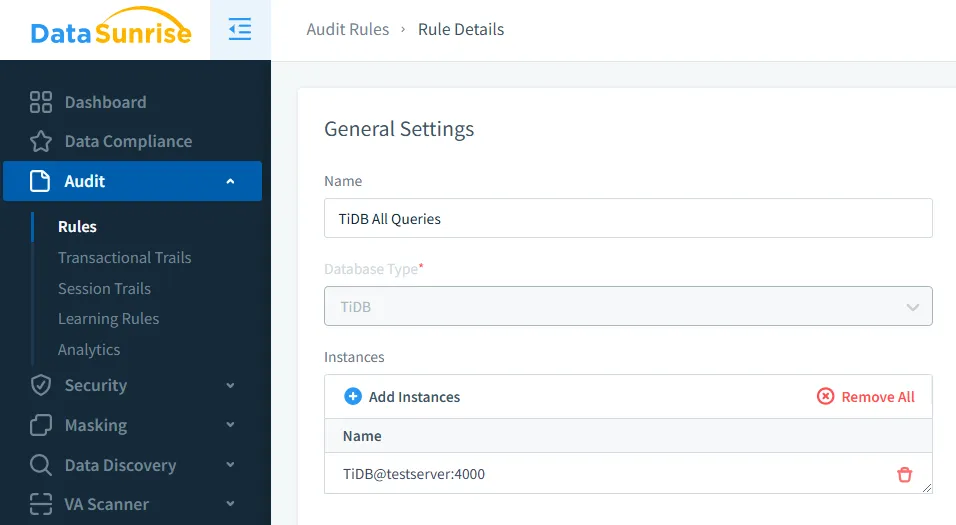
Now that the connection is established, the next step is to define an audit rule. DataSunrise allows you to create highly customizable rules to track specific database activities, such as unauthorized access attempts, data modifications, or even queries executed by privileged users. By configuring these rules, you ensure that every critical action is logged and analyzed.
Step 3: View the TiDB Audit Trail
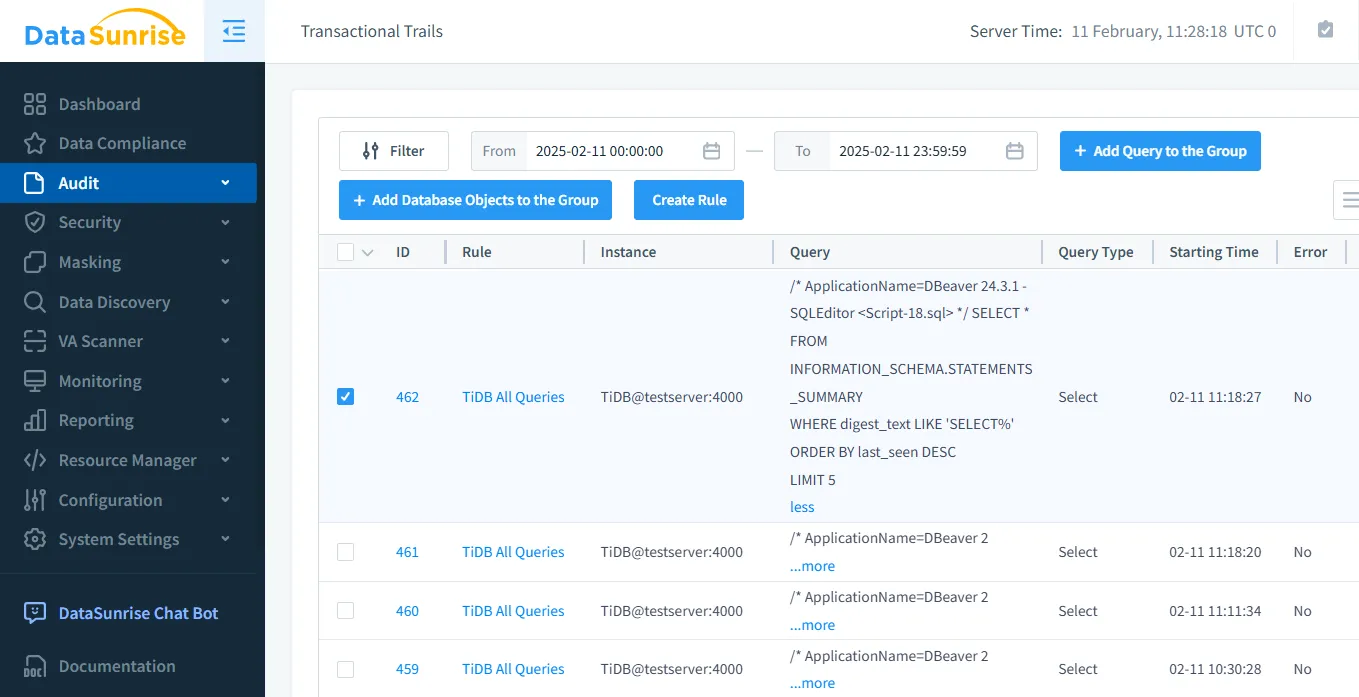
Once your audit rules are in place, you can navigate to the Transactional Trails section in DataSunrise to view recorded events. From here, you can filter logs by user, query type, timestamp, and more to analyze database activity effectively.
Trail Analysis and Reporting
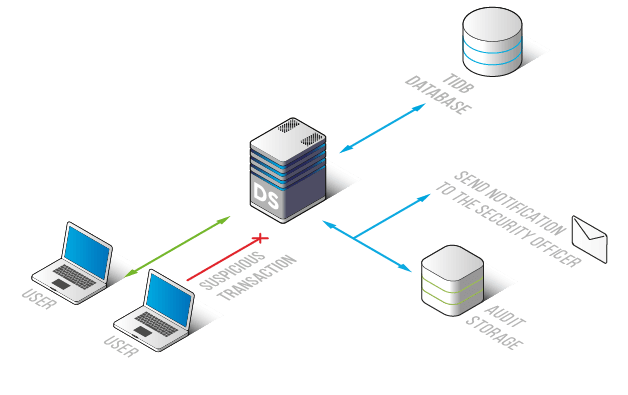
DataSunrise provides an extensive audit trail system that captures every relevant database event with precision. With real-time monitoring, detailed logging, and advanced filtering options, you can quickly identify suspicious activities, maintain compliance, and generate insightful reports. Whether you need to track access patterns, pinpoint anomalies, or investigate security incidents, DataSunrise delivers the visibility and control necessary to safeguard your TiDB environment. Some of the key features include:
- Database activity monitoring with real-time alerts
- Behavioral analytics for detecting anomalies
- Automated compliance reporting for standards like GDPR, HIPAA, and PCI DSS
- Dynamic data masking in audit trails for sensitive information
Conclusion
While TiDB's native audit trail functionality provides essential logging capabilities, integrating DataSunrise significantly boosts your database security. DataSunrise offers centralized control, detailed reporting, and real-time alerts, streamlining your auditing processes. Additionally, it delivers deeper insights into database activities.
Experience the full capabilities of DataSunrise by scheduling a live demonstration and learn how it can elevate your TiDB audit trail management and security monitoring strategy.