DataSunrise Database Activity Monitoring for SAP HANA
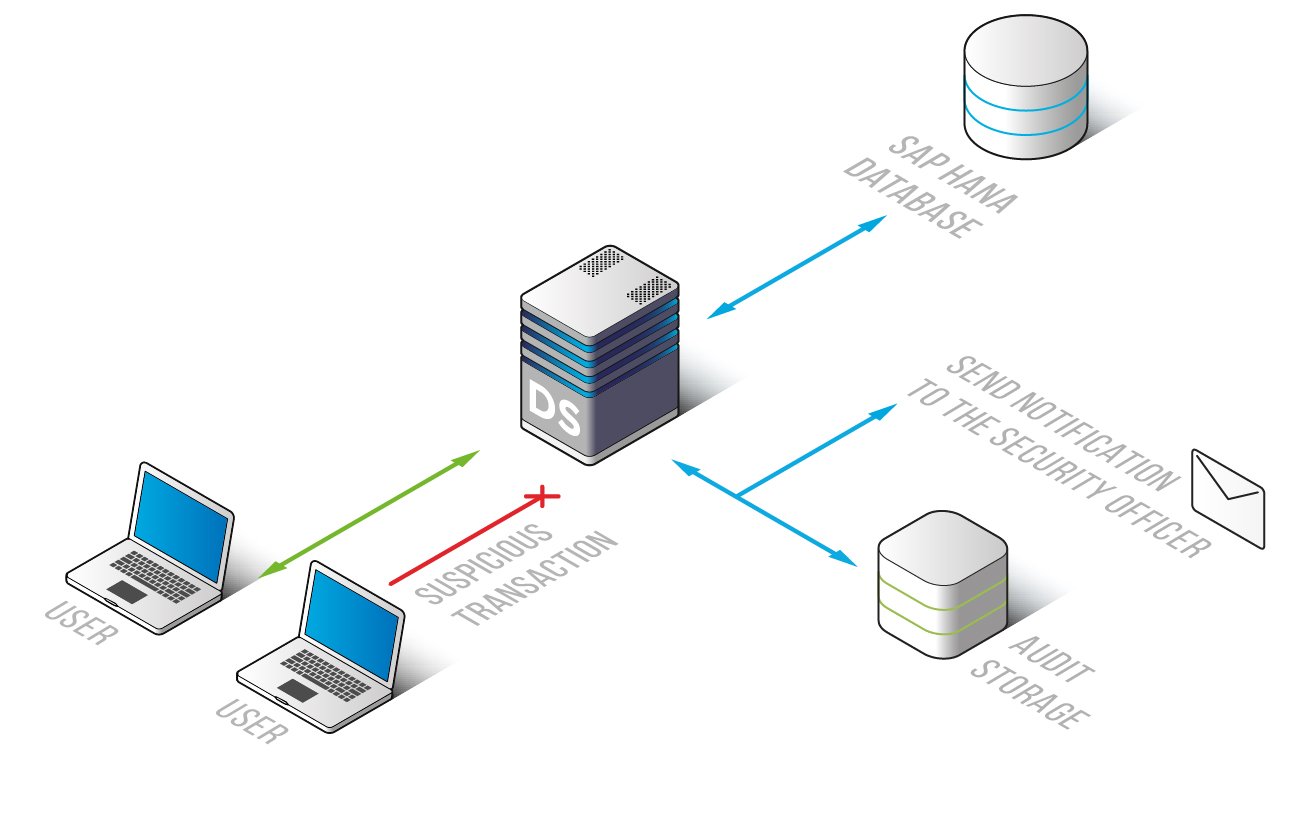
Adapt DataSunrise to suit your purposes via functional integrated SAP HANA activity monitoring tools specifically dedicated to depicting a clear picture of user and client application behavior. Trace database activity in real time, investigate data breaches, detect suspicious user behavior, reveal database security system vulnerabilities and be immediately notified of any unauthorized action.
DataSunrise Database Activity Monitoring for SAP HANA is an effective visualization tool adjusted to perform various functions. It logs all database events thus providing an opportunity to control incoming queries and database responses.
With the Sniffer mode turned on, SAP HANA monitoring solution analyzes incoming traffic without requiring any alterations made to the database by client applications. Limited to continuous monitoring only, the mode is considered rather effective in auditing database activity and alarming database administrator in case of any violations. The Proxy mode in its turn after having some modifications made to the server, offers more opportunities, such as modifying user queries and blocking the ones that contravene security policies.

The monitoring tools collect data on all user activity. No changes to SAP HANA are left unnoticed. The software product memorizes typical user behavior and makes a list of authorized SQL queries, as well as prohibited ones. A database administrator can easily set the Learning Rules to manage this self-learning process. According to the mentioned lists and settings, restricted queries are blocked, and the database administrator is instantly notified of the fact.
Data generated during monitoring is saved by default in the SQLite database integrated into DataSunrise. It may also be kept in any other specified external databases. DataSunrise Database Activity Monitoring for SAP HANA provides accurate and comprehensive overview of database activity, notably database user information (i.e. username, hostname), client application (i.e. application name, hostname), SQL query code, session start and end time, affected or updated row number; query result and indication of database errors, if any. The information can be illustrated in the form of a table or a chart.


