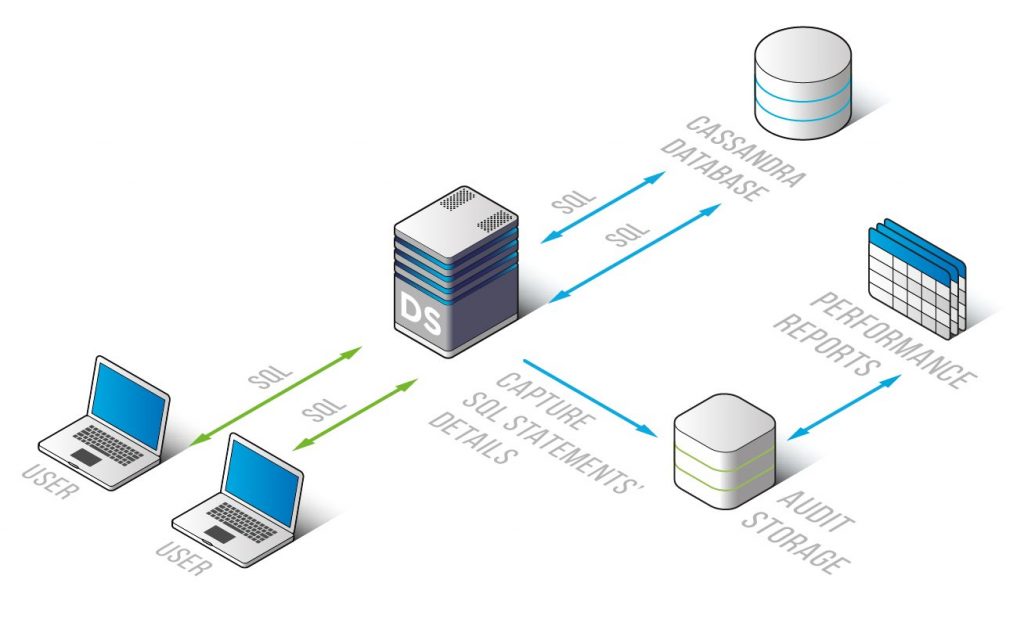
DataSunrise Database Performance Monitoring for Apache Cassandra
Cassandra Database Performance Monitoring from DataSunrise is a convenient tool for database owners and admins to get a clear picture of their database performance. This information can come in very handy for debugging and development, bottleneck identification and operation delays rectification. If you have any problem with your Cassandra database, it can be analyzed based on the information collected by Database Performance Monitoring tool from DataSunrise.
DataSunrise Database Security Suite is a very powerful tool to secure your Cassandra databases. One of the Suite’s features is Database Performance Monitoring. This tool collects the information about Cassandra databases performance. Using this information database owners, admins and developers can identify performance problems.

Performance monitoring makes available the following information:
- Audit section: processing speed is measured and the audit queue length is presented.
- Traffic section: traffic from DB to user and vice versa is analyzed.
- Free Space section: information on available free space for your Cassandra databases.
- Memory section: information on free memory for your Cassandra databases. Traffic Buffers.
- Queues section: information on audit queue length, proxy message handler queue length, sniffer message handler queue length.
In general, a developer can start analyzing the problem by looking into a query log and identifying redundant and unexpected query. Looking through the SQL command list also helps to understand what the source of the Cassandra performance problems might be. And knowing the source of the problems helps to resolve the problem.
Cassandra database performance monitoring is yet another convenient and user-friendly tool from the DataSunrise company to ensure stable and safe operation of proprietary databases.


