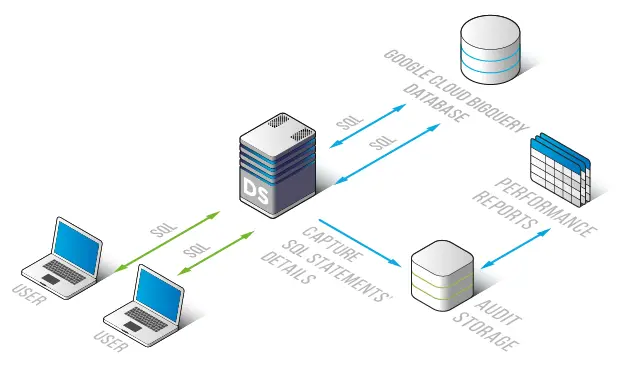
Performance Monitoring for Google Cloud BigQuery
DataSunrise Performance Monitoring for BigQuery depicts a clear picture of database performance in the form of logged data. This solution enables the administrators to examine its processes to find a solution to overcome any obstacles to effective functionality.
DataSunrise Performance Monitoring provides data and diagrams that will help you to understand and eliminate what interferes with proper functioning. Logs include the following information:
- Query log
- Query result log
- Query execution time
- Query types
- Row number in INSERT/UPDATE/DELETE/SELECT operations
- Operation number per second
- Data volume transmitted or received by a server, and more
This information allows developers to spot redundant and unexpected queries. Also, Performance Monitoring functionality can be useful to analyze application functioning, when its own logging is not enough or is not included altogether. When you look through the query list, it can help you to identify some performance problems your BigQuery may encounter and find a solution for them.

There is an ability to trace the dynamics of query change in time, and the execution frequency of INSERT/UPDATE/DELETE/SELECT types. You can use the diagram to see how they change in time, as well as other information related to BigQuery monitoring.
DataSunrise Performance Monitoring helps to minimize efforts wasted on monitoring BigQuery performance and expenses arising from collecting data to detect obstacles preventing its normal operation. Collected information is sufficient for assessment purposes, as far as there is no need to install any extra tools to analyze BigQuery processes and operation delays.


