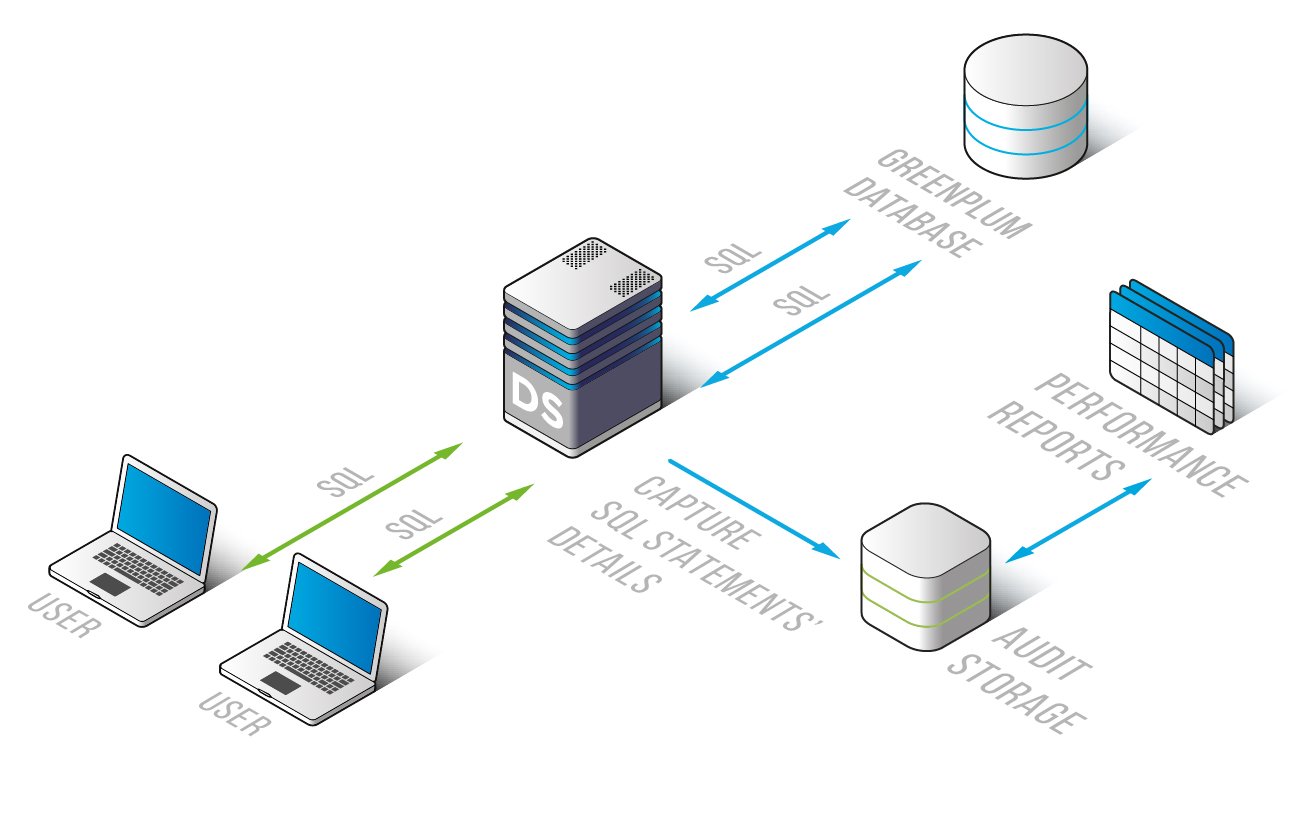
DataSunrise Database Performance Monitoring for Greenplum
Get the clear picture of Greenplum performance via DataSunrise Database Performance Monitoring Tools. Logged data may serve as an expedient means for application debugging and development, bottleneck identification, assessment of DBMS processes and operating delays. Any problems confronted during Greenplum operation can be analyzed on the basis of information collected by DataSunrise.
Among all the major advantages of DataSunrise Data and Database Security Suite there is database performance monitoring. Having analyzed information collected by the product, a DB developer can identify some performance problems.

Examples may include but are not limited to the ability to evaluate queries executed in transactions in order to detect weak points in separate operations, examine initiated scripts and spot the ones that cause problems, look through the list of SQL commands, debug and develop applications, etc.
In other words, DataSunrise Database Performance Monitoring Tools allow to get a clear visualization of Greenplum processes, make a detailed analysis of DBMS performance problems and find the right solution on the basis of information logged by the product. For this purpose the following data can be effectively used and assessed:
- logging of queries that are sent to Greenplum as well as its responses;
- time spent on query execution and visualization of its change dynamics in time;
- INSERT/UPDATE/DELETE/SELECT types and their execution frequency;
- operations per second;
- data volume transmitted or received by the server
- row number in INSERT/UPDATE/DELETE/SELECT operations and diagrams that show their change in time;
- other DBMS performance information.
Generally speaking, DataSunrise multifunctional high-quality product encompasses database performance monitoring means to facilitate DBMS error detection, thus ensuring constant Greenplum performance control.


