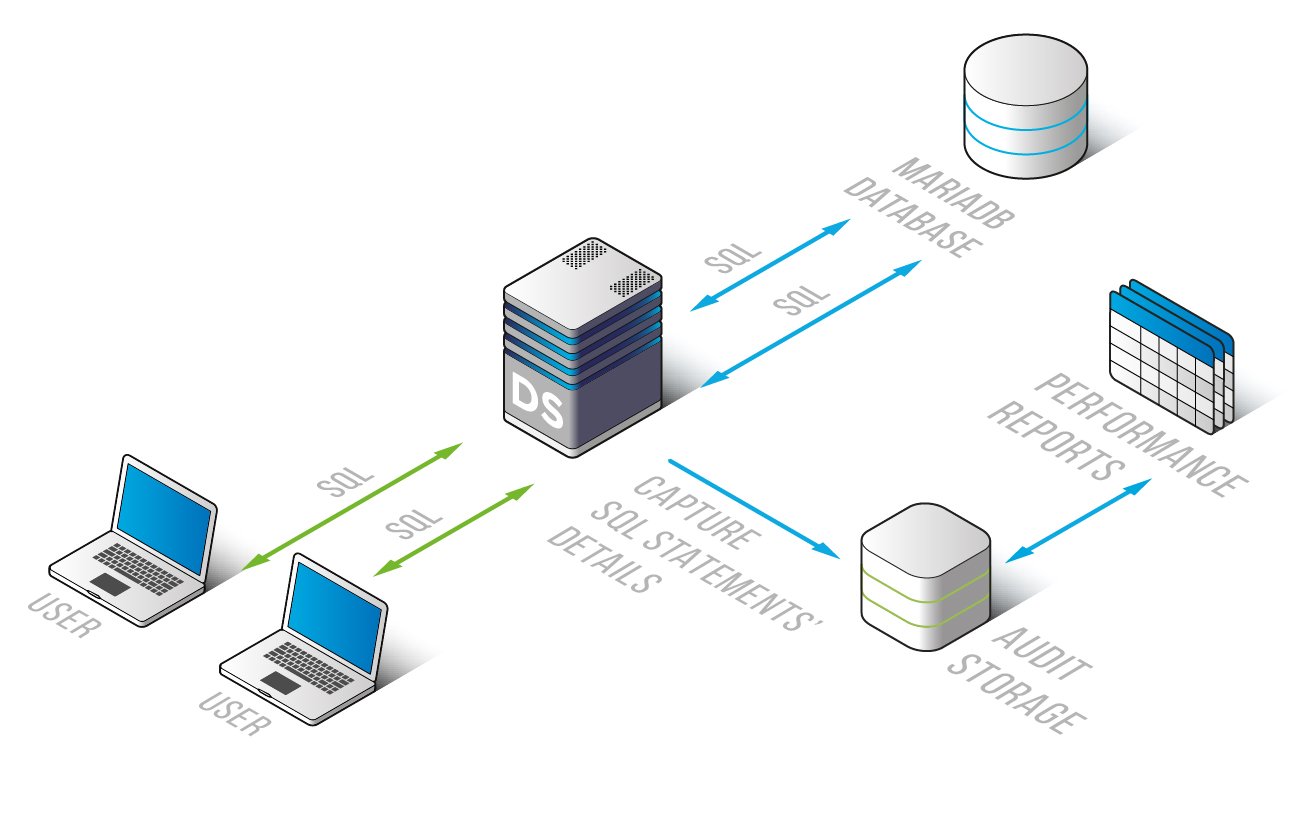
DataSunrise Database Performance Monitoring for MariaDB
Monitor MariaDB performance and detect its operation errors via DataSunrise Database Performance Monitoring Tools. Effective assessment solution that enables to examine DBMS operations and spot any encountered problems in time. Essential means for any DB developer for application debugging and development, performance examination, tracking down of weak points that cause operation delay, etc.
Being a multifunctional product, DataSunrise along with its main protective ability offers an efficient means to simplify the process of solving problems arisen out of system malfunctions and software errors.
It monitors database performance thus enabling to identify bottlenecks during MariaDB operation, assess operating delays, debug and develop applications, etc.
You may adapt data logged by DataSunrise to suit your needs, especially in locating and analyzing any performance problem that MariaDB faces, identifying what causes it, solving it as well as preventing its recurrence. The following tools provided by DataSunrise are available for a DB developer:
- Query log. You may identify any redundant queries or queries that were not expected by a developer.
- Query result log. The tool may play a significant role in detecting vulnerabilities in an application, when its own logging is not sufficient or is not provided at all.
- Query execution time and ability to track down dynamics of query change in time.
- Query types as well as frequency of their execution (INSERT/UPDATE/DELETE/SELECT).
- Row number in INSERT/UPDATE/DELETE/SELECT operations and diagrams illustrating how they change in time.
- Operation number per second.
- Data volume transmitted and received by the server.
- Other information related to database performance monitoring.

The above-mentioned DBMS data is comprehensive enough to be effectively used in finding solutions to some confronted performance problems.


