DataSunrise Database Performance Monitoring for Percona Server
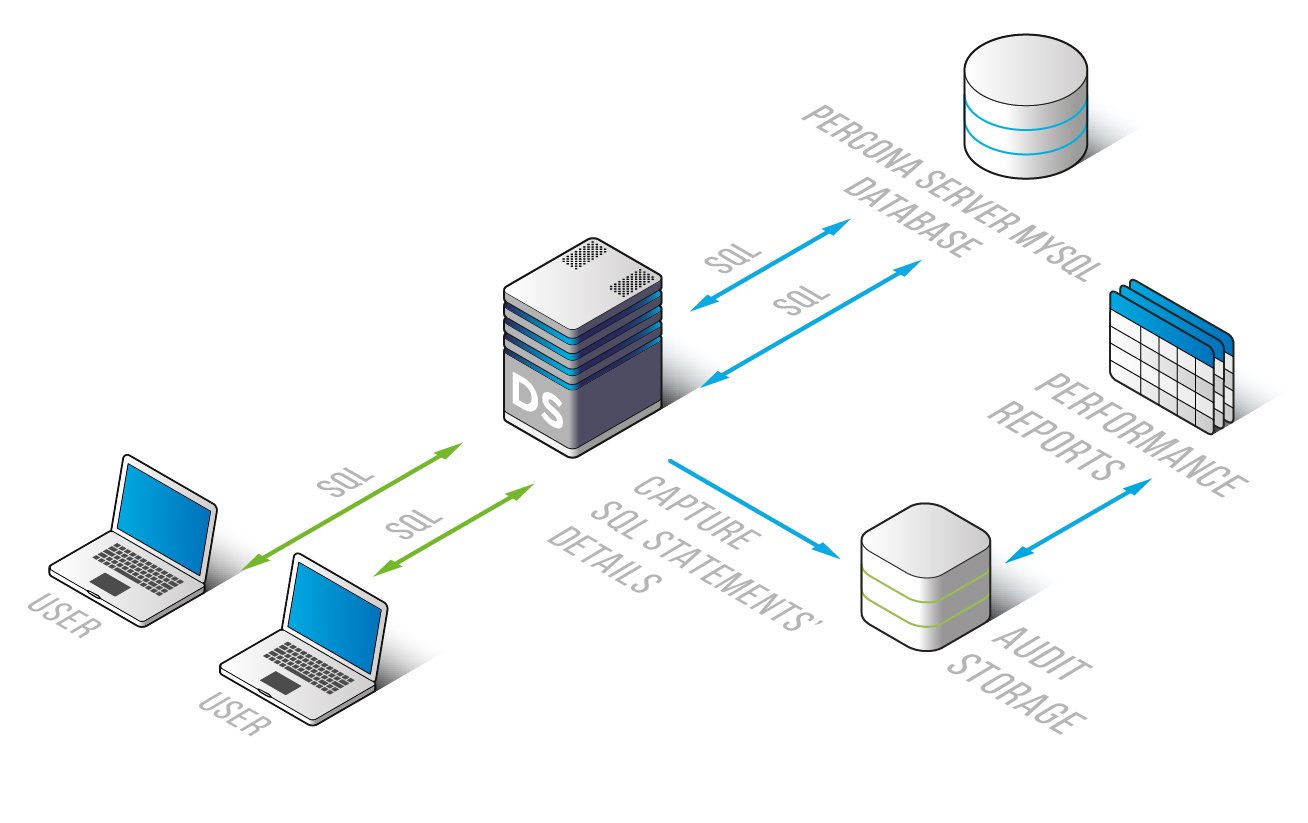
DataSunrise software product with its integrated Database Performance Monitoring Tools compatible with Percona Server functions as an effective mechanism for accurately detecting and eliminating disruptions to normal DBMS functioning thus simplifying Percona performance troubleshooting.

DataSunrise accurately and comprehensively monitors Percona performance making the following information available for a DB developer for processing and analyzing:
- Percona monitoring and logging of queries that are sent to Percona Server databases. You will be able to get the clear picture that may be useful, for instance, to detect redundant queries as well as the ones that have not been expected by a developer.
- Percona monitoring and logging of responses. The tool is handy for identifying problems appeared during application functioning, when logging cannot be adjusted to an application itself, or the situation requires to have an extra one in addition to it.
- Time spent to execute queries. It is possible to analyze the dynamics of how a query changes in time.
- Query types (INSERT/UPDATE/DELETE/SELECT). Their execution frequency is also clearly seen.
- Row number in INSERT/UPDATE/DELETE/SELECT operations and their change in time are illustrated in a diagram.
- Number of operations executed per second.
- Data volume transferred and received by a server.
The analysis of the Percona monitoring information collected by DataSunrise facilitates the assessment of DBMS processes, identification of operating delay causes, application debugging and development, as well as gives a timely warning so that precautious measures are taken to prevent potential pitfalls of Percona processes.


