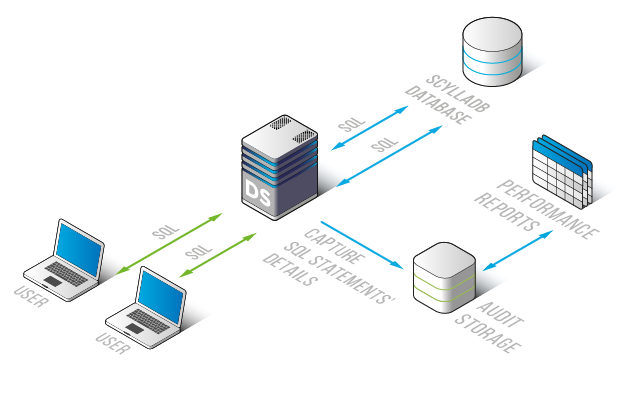
DataSunrise Database Performance Monitoring for Scylla
DataSunrise Database Performance Monitoring for Scylla is a tool for database owners and DBA to help you detect and fix performance problems with Scylla, as well as get a complete picture of its workflow. This tool allows you to timely identify vulnerabilities and weaknesses, and find operation delays rectification. DataSunrise Database Performance Monitoring helps you to conduct a competent analysis of possible problems.
Performance Monitoring gives access to the section of audit, traffic, memory, free space, queues. Thus, you get complete information and analysis about the work of the Scylla database. You will get access to such information as measuring the processing speed and displaying the length of the audit queue, analyzing the database traffic to the user, information about the available free space, etc.

Data and diagrams logged by DataSunrise ensure accurate and comprehensive visualization of Scylla processes. Monitor database performance with the following DataSunrise tools:
- Logging of all queries to Scylla. Evaluate queries executed in transactions and identify weaknesses in separate transactions;
- Logging of responses to all queries;
- The amount of data transmitted or received by a server;
- The number of operations per second;
- The time spent on the execution of a query;
- Execution frequency of INSERT/UPDATE/DELETE/SELECT query types;
- Row numbers that fall under INSERT/UPDATE/DELETE/SELECT operations.
The DataSunrise Database Performance Monitoring tool ensures constant Scylla performance control and the accurate and deep understanding of Scylla's processes to troubleshoot any problem.


